In XBRL reporting, facts help build a multi-dimensional space, where each fact has a different meaning based on its context. These contexts are called "dimension members," and they help organize the facts. For example, if we have values for two elements, "USD" and "EUR," then the dimension "unit" has two members. Some facts may use USD, while others use EUR. We can group the facts based on any of the dimension members.
XBRL allows us to create custom dimensions in addition to the primary dimensions such as reporting concept, currency, and period.
The XBRL consortium has created a specification that explains how to create and use these custom dimensions, which you can find here:
Explicit Dimensions
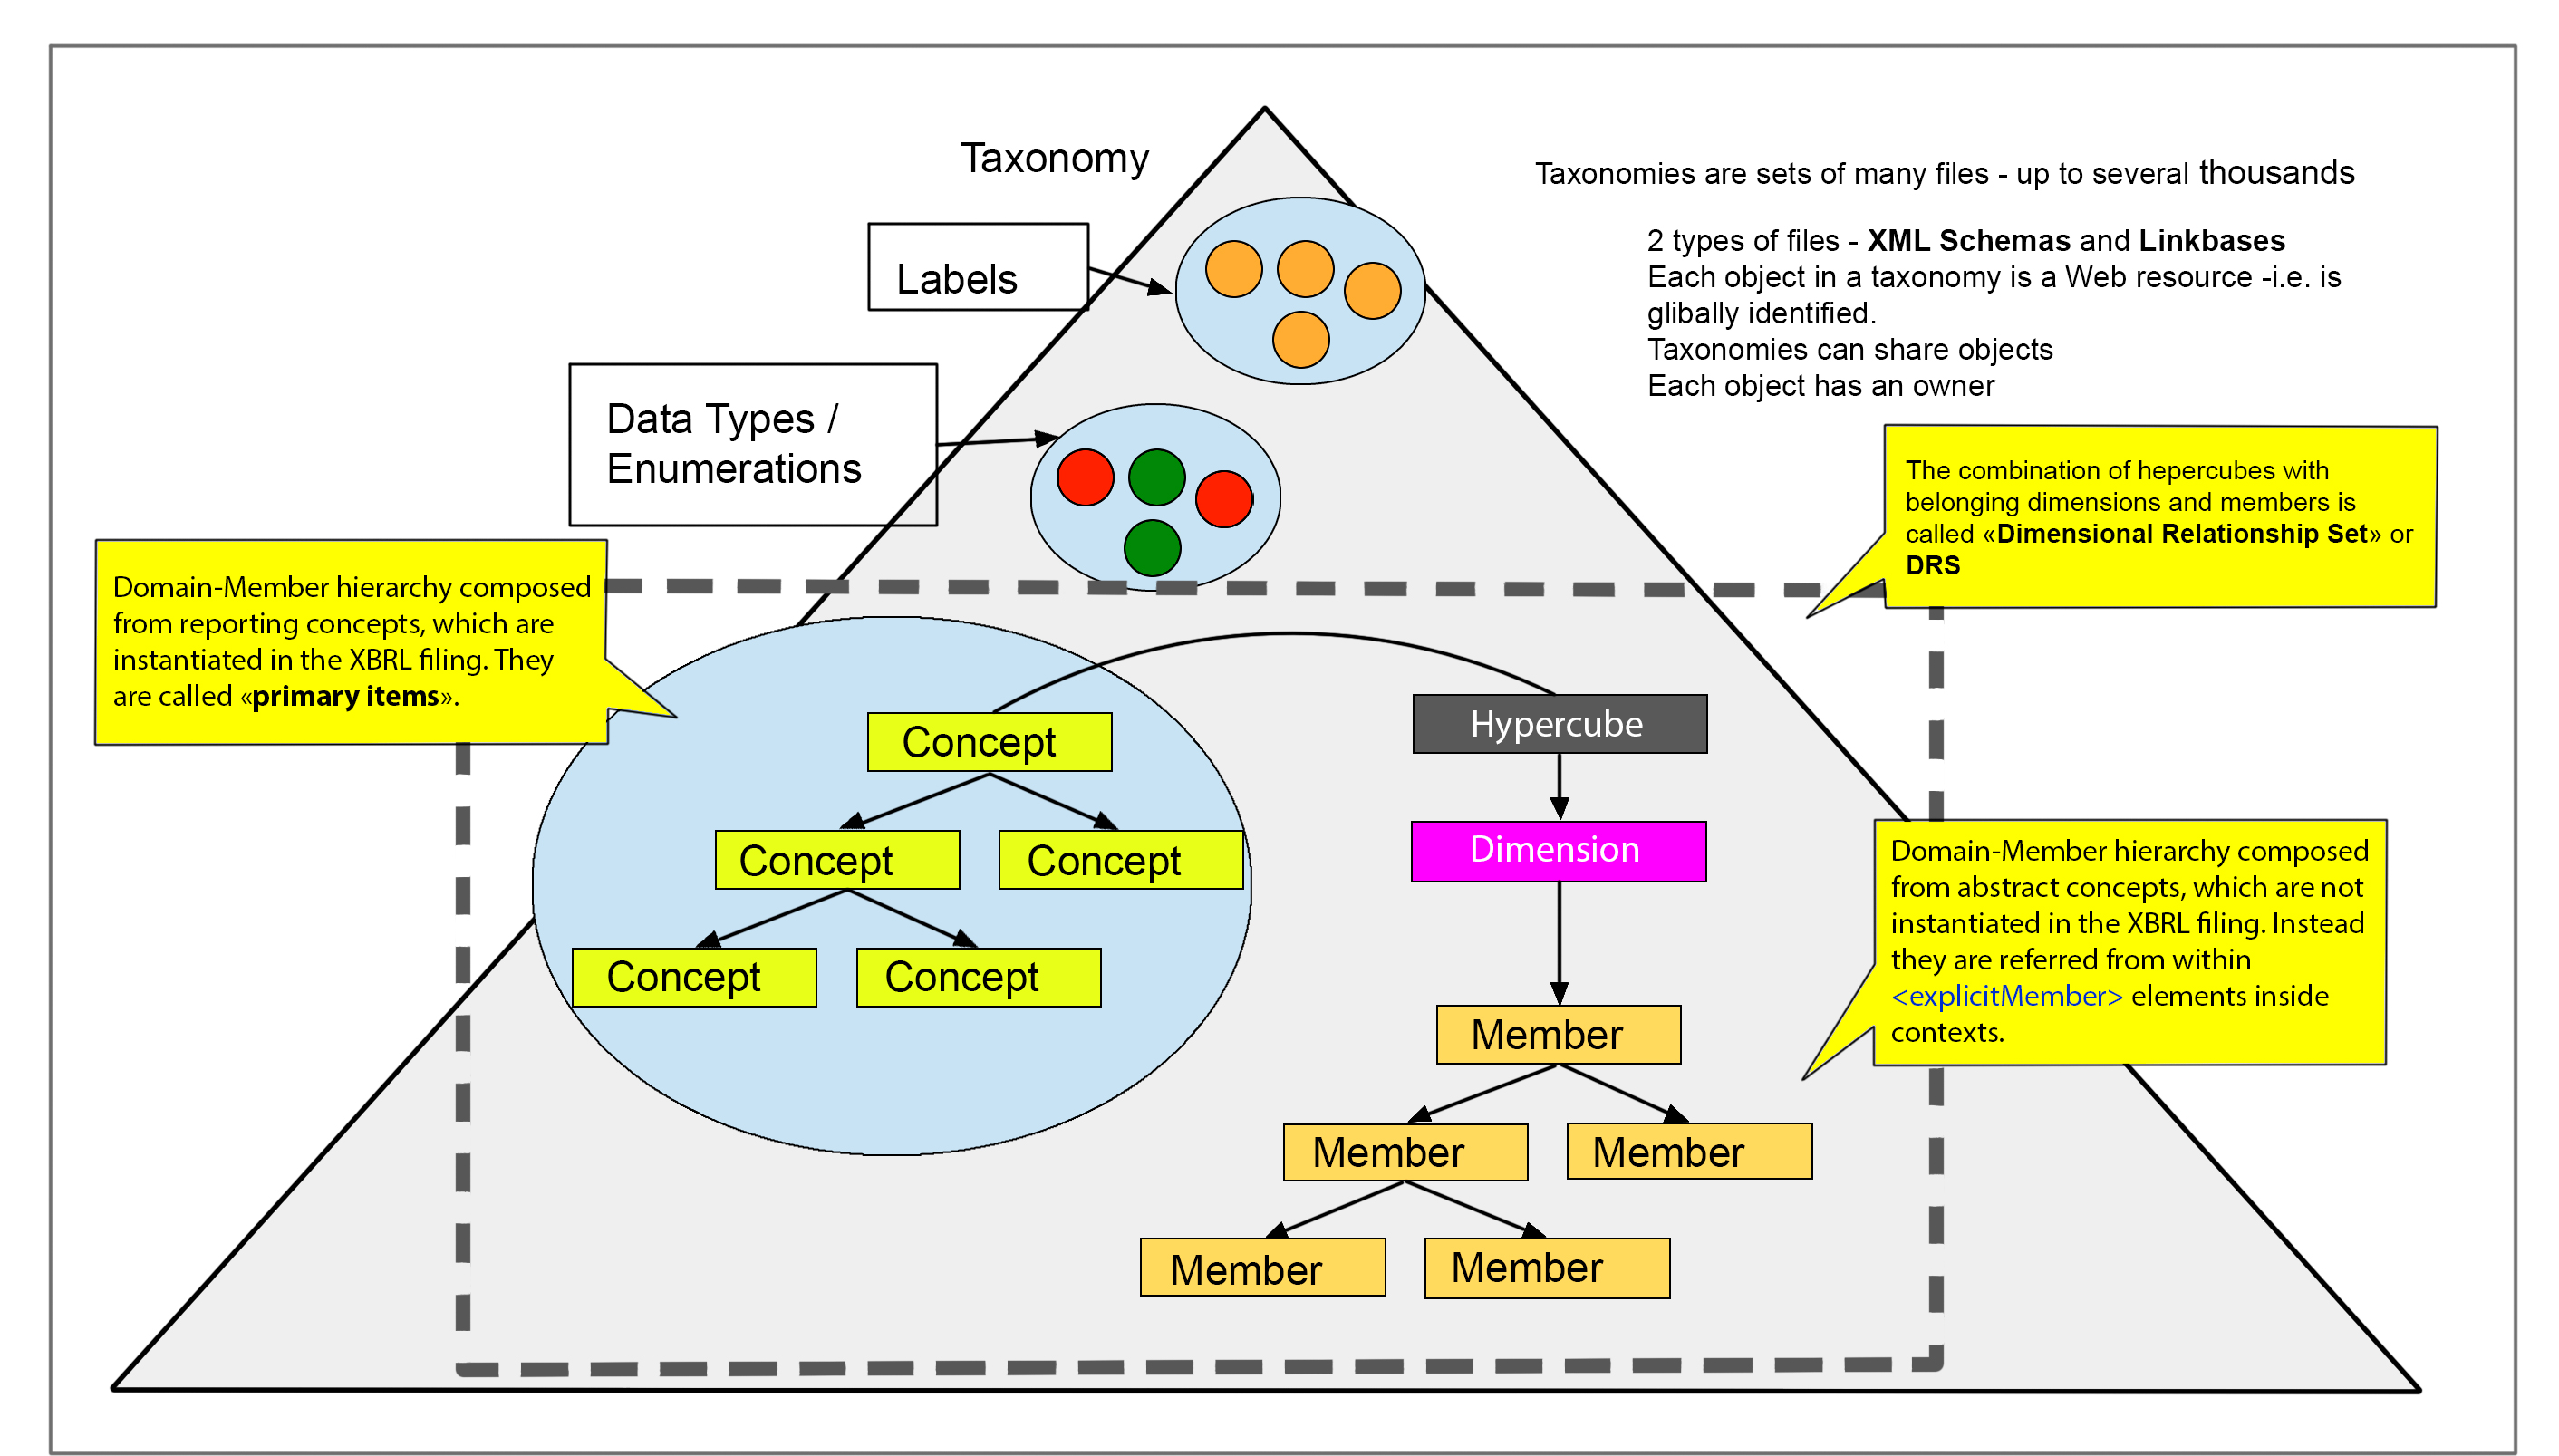
Explicit dimensions are a type of dimension used in XBRL, which have a set of elements that are already defined in the taxonomy. In other words, the values for explicit dimensions are predetermined and cannot be changed by the user. An example of an explicit dimension is "Product Type", where the possible elements could be "Cars", "Electronics", and "Clothing". These elements are specified in the taxonomy and cannot be altered by the user. Explicit dimensions provide a standardized way of reporting data in XBRL, making it easier for different organizations to compare and analyze financial information.
Typed Dimensions
Typed dimensions in XBRL are dimensions that can have any value defined by the user. These dimensions allow users to create their own set of elements within the taxonomy, instead of being limited to a pre-defined set like in explicit dimensions. However, there are some dimensions such as "Country" or "Currency" that have a closed set of values that cannot be invented by the user. Typed dimensions can be useful for creating custom dimensions such as "Identification Number", "Customer Name", or "Customer Age Range". These dimensions are organized in collections called hypercubes, and their members can be hierarchically organized.
Dimension members can be organized in a hierarchy, such as countries grouped by geographic regions. Some members in the hierarchy may be marked as "not-usable" and only serve to create the hierarchy, not to be used as actual elements. Dimensions can't be organized into a hierarchy when they're grouped together in a hypercube collection.

The reason for these complex definitions is to make data reusable. Let's say you want to create a custom dimension called "European countries." Instead of starting from scratch and defining each country individually, you can define a dimension concept called "mynamespace:eastEuropednCountriesAxis" and set up relationships between this dimension and the relevant country elements. This saves time and makes it easier to reuse data.
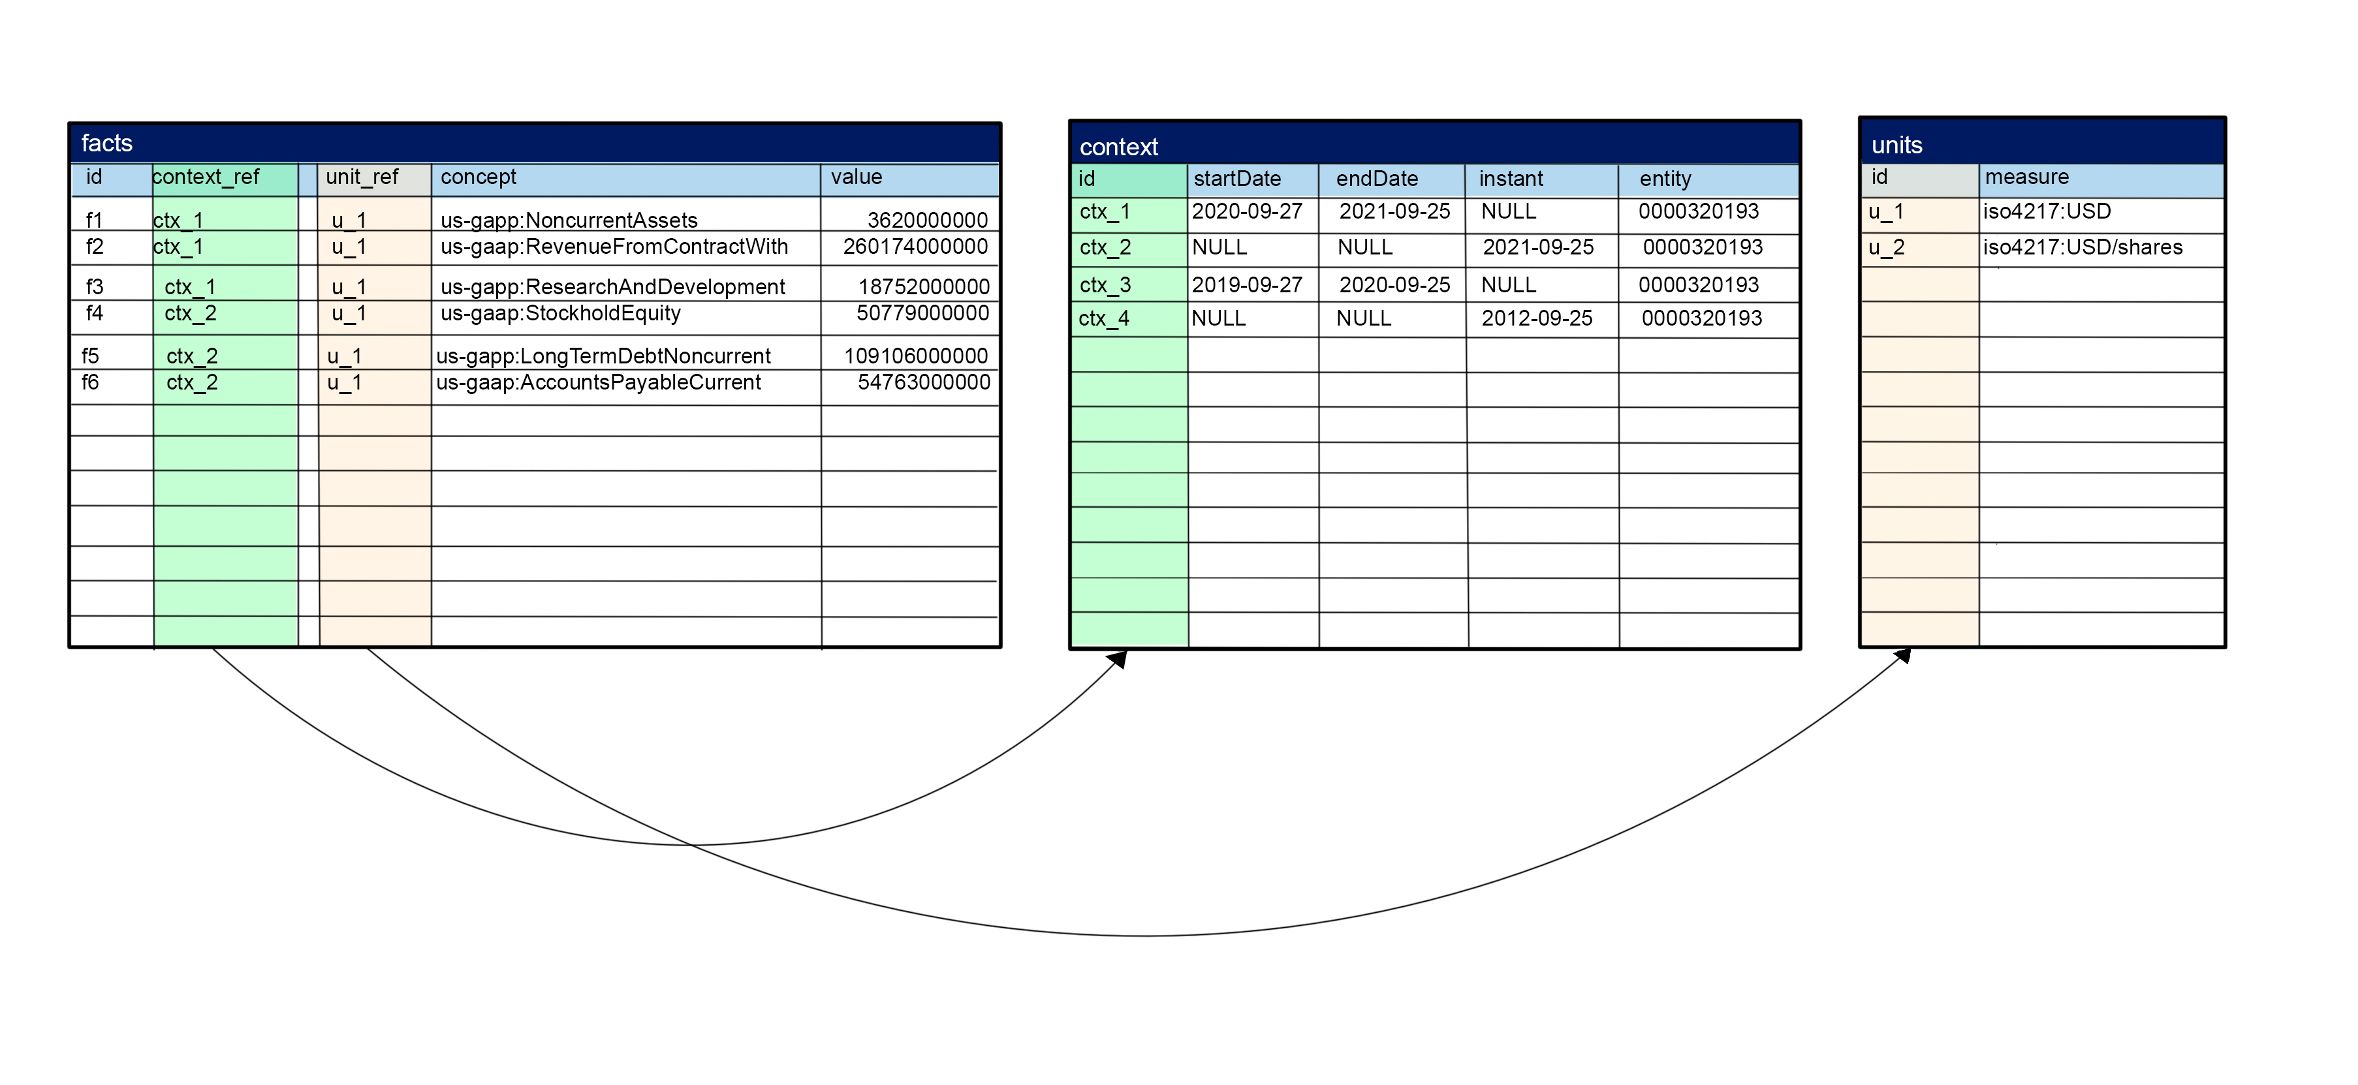
In an XBRL filing, each fact is connected to its corresponding dimension member by using an <context> element. The member "unit" dimension is represented by a separate element called <unit>. To simplify this representation, an XBRL filing can be thought of as three relational database tables - "contexts", "units", and "facts" - where there is a one-to-many relationship between each context and its corresponding fact, as well as between each unit and its corresponding fact.
The formulas for this relationship can be expressed as:
These formulas help to show how dimensions and members are related to facts in an XBRL filing.


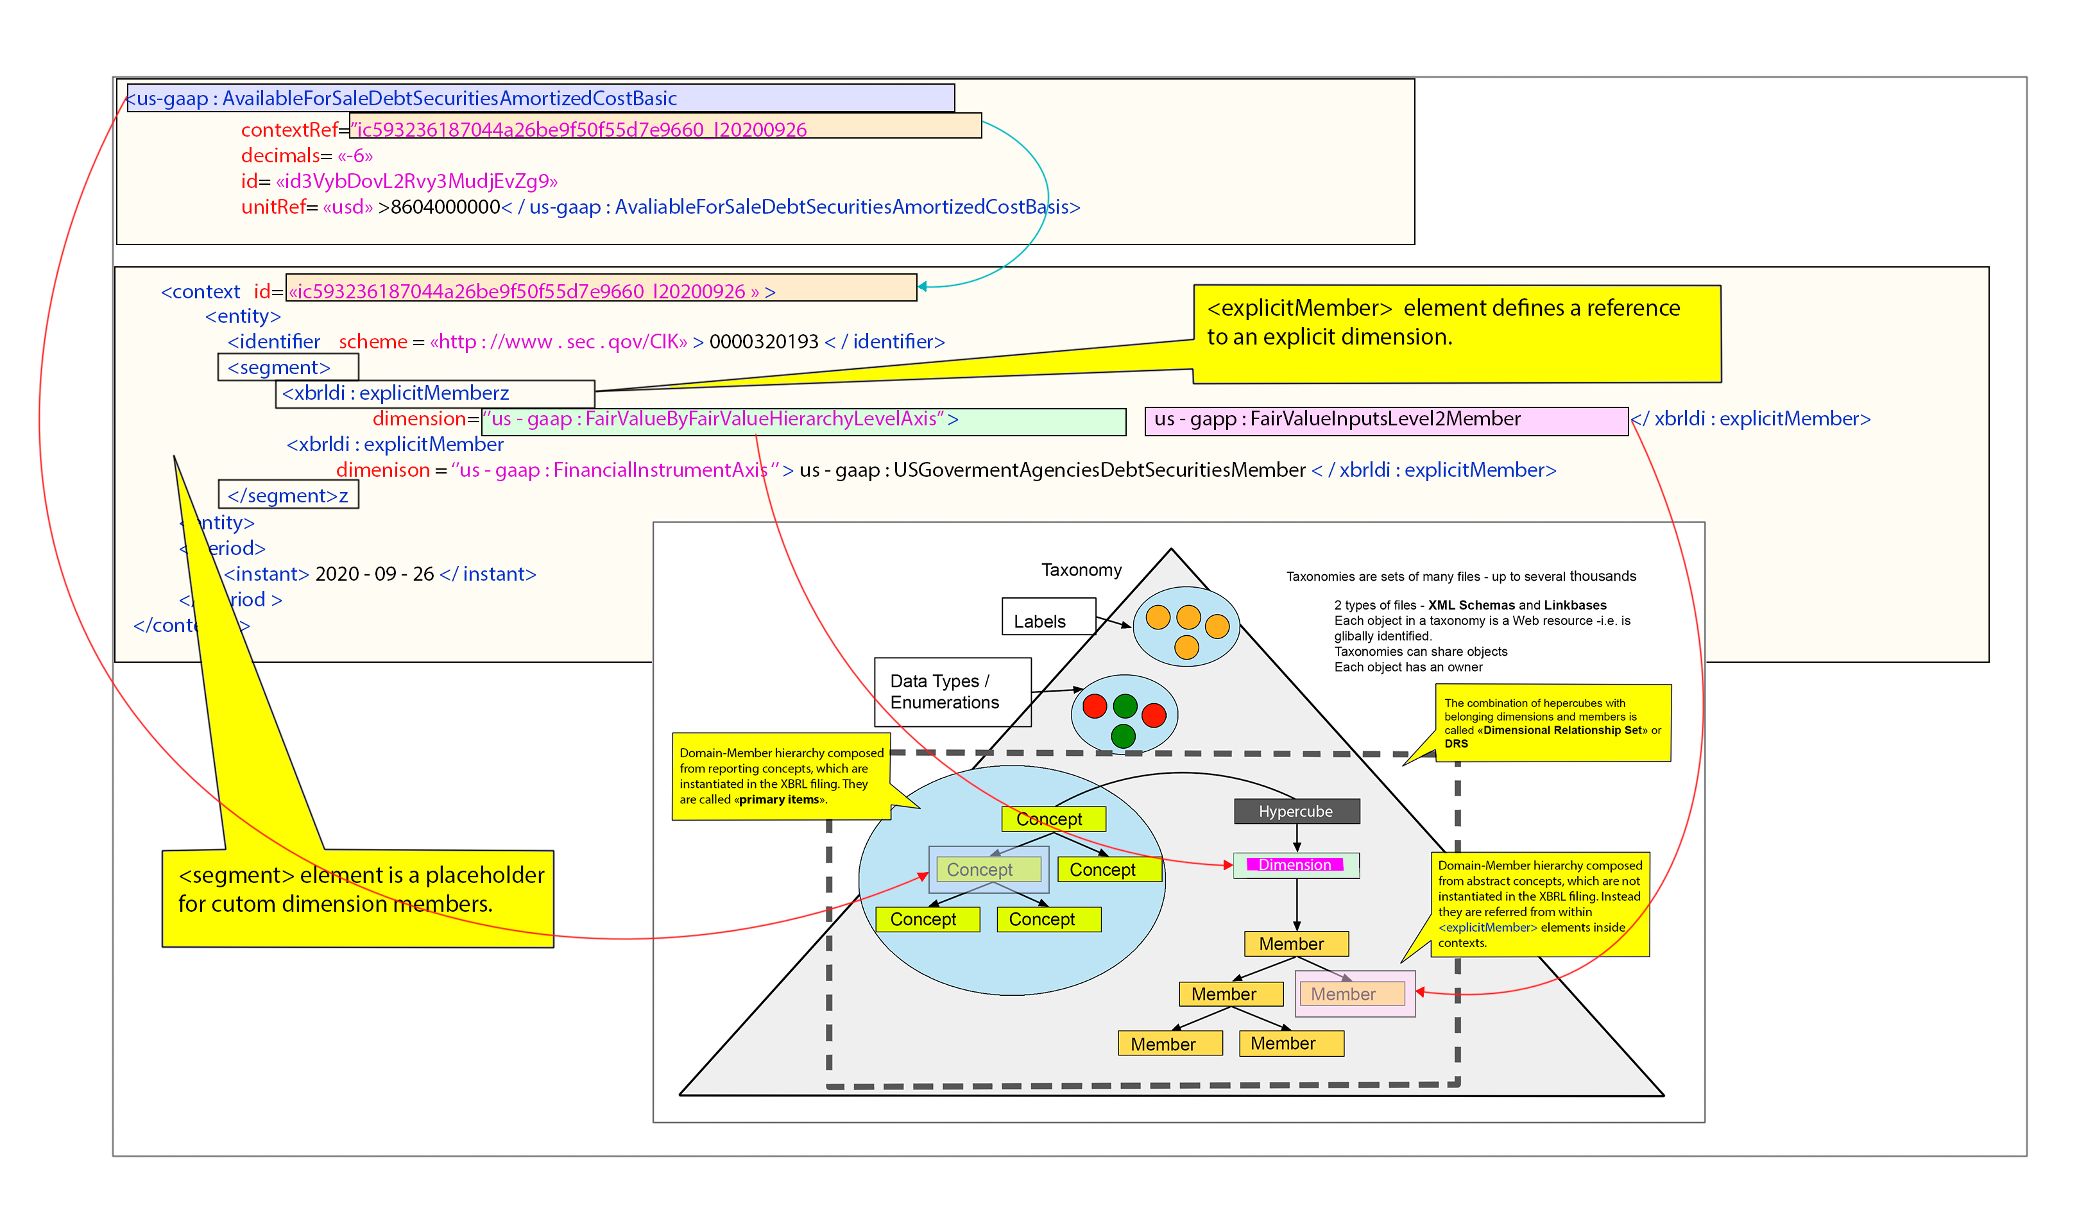
To show the relationship between a custom dimension and a fact, use either <explicitMember> or <typedMember>. With <explicitMember>, put the dimension's name in the "dimension" part and the member's name in the text. With <typedMember>, put the dimension's name in the "dimension" part and the member's value in the text.
The <segment> element is where you put the custom dimension's members in the context. It's under the <entity> element. Another element called <scenario> can also be used, but <scenario> is mainly used in SEC/EDGAR reporting
You will receive the information that help to do investments.
Note: Check the spam folder if you don't receive an email.
