
Segmentation is a process of dividing a large piece of information or data into smaller parts based on certain criteria. This helps businesses to analyze and understand their data better.
The way segmentation is done is called "dimension", and the individual parts are called "dimension members". A dimension could be any category that a business wants to analyze, such as "geographic region", "product category", or "time period". The dimension members would be specific parts of that category. For example, if the dimension is "geographic region", the members could be "North America", "Europe", "Asia", and so on.
Product segmentation
This means dividing data based on different products or services that a business offers. For example, a software company may want to segment its revenue based on the different software products they sell.
This is done through as_reported_sec_annual_revenue_geographic_segmentation and as_reported_sec_quarter_revenue_geographic_segmentation.
Geographic segmentation
This means dividing data based on different geographic regions. For example, a multinational company may want to segment its revenue based on the different countries or regions they operate in.
This is done through as_reported_sec_annual_revenue_product_segmentation and as_reported_sec_quarter_revenue_product_segmentation.
In XBRL reports, "segmentation ion information" means data that is broken down into smaller parts. This information is saved in "elements", which are like boxes that hold specific data. One example of an element is called a "context". A context gives more details about the segment of data being analyzed, like the time period or location. By using contexts and other elements, businesses can better understand their data.
<context id="ifc47642a3e864efb800531fce864095b_D20200927-20210925">
    <entity><identifier scheme="http://www.sec.gov/CIK">0000320193</identifier>
        <segment>
            <xbrldi:explicitMember dimension="srt:ProductOrServiceAxis">aapl:WearablesHomeandAccessoriesMember</xbrldi:explicitMember>
        </segment>
    </entity>
    <period><startDate>2020-09-27</startDate><endDate>2021-09-25</endDate></period>
</context>
It's possible to have several pairs of "dimension/member" in one "context". This means that there can be more than one category and subcategory of data being analyzed within a single context.
<context id="i57723b15b6f24b7aa81c542f8f4d99fd_I20210925">
    <entity><identifier scheme="http://www.sec.gov/CIK">0000320193</identifier>
        <segment>
            <xbrldi:explicitMember dimension="us-gaap:FairValueByFairValueHierarchyLevelAxis">us-gaap:FairValueInputsLevel2Member</xbrldi:explicitMember>
            <xbrldi:explicitMember dimension="us-gaap:FinancialInstrumentAxis">us-gaap:CorporateDebtSecuritiesMember</xbrldi:explicitMember>
        </segment>
    </entity>
    <period><instant>2021-09-25</instant></period>
</context>
Every "dimension" in XBRL reports is recognized by a specific label called a QName. This label helps to identify and categorize the data being analyzed. For example, the dimension "Product or Service Axis" might be labeled as "srt:ProductOrServiceAxis". The individual parts of that dimension, called "dimension members", also have their labels. These labels are called "QNames" as well. For instance, a specific "Wearables, Home, and Accessories" dimension member might be labeled as "aapl:WearablesHomeandAccessoriesMember".
Think of dimensions as different types of information, like different colors of crayons. Each dimension is labeled with a specific name to help keep things organized. Within each dimension, there are different parts called "dimension members". You can think of these as the different shades of a crayon color, like light blue or dark blue. Each dimension member also has its label, or name, to help identify it.
By using these labels, businesses can more easily sort and analyze their data, like putting all the blue crayons in one pile and all the red crayons in another.
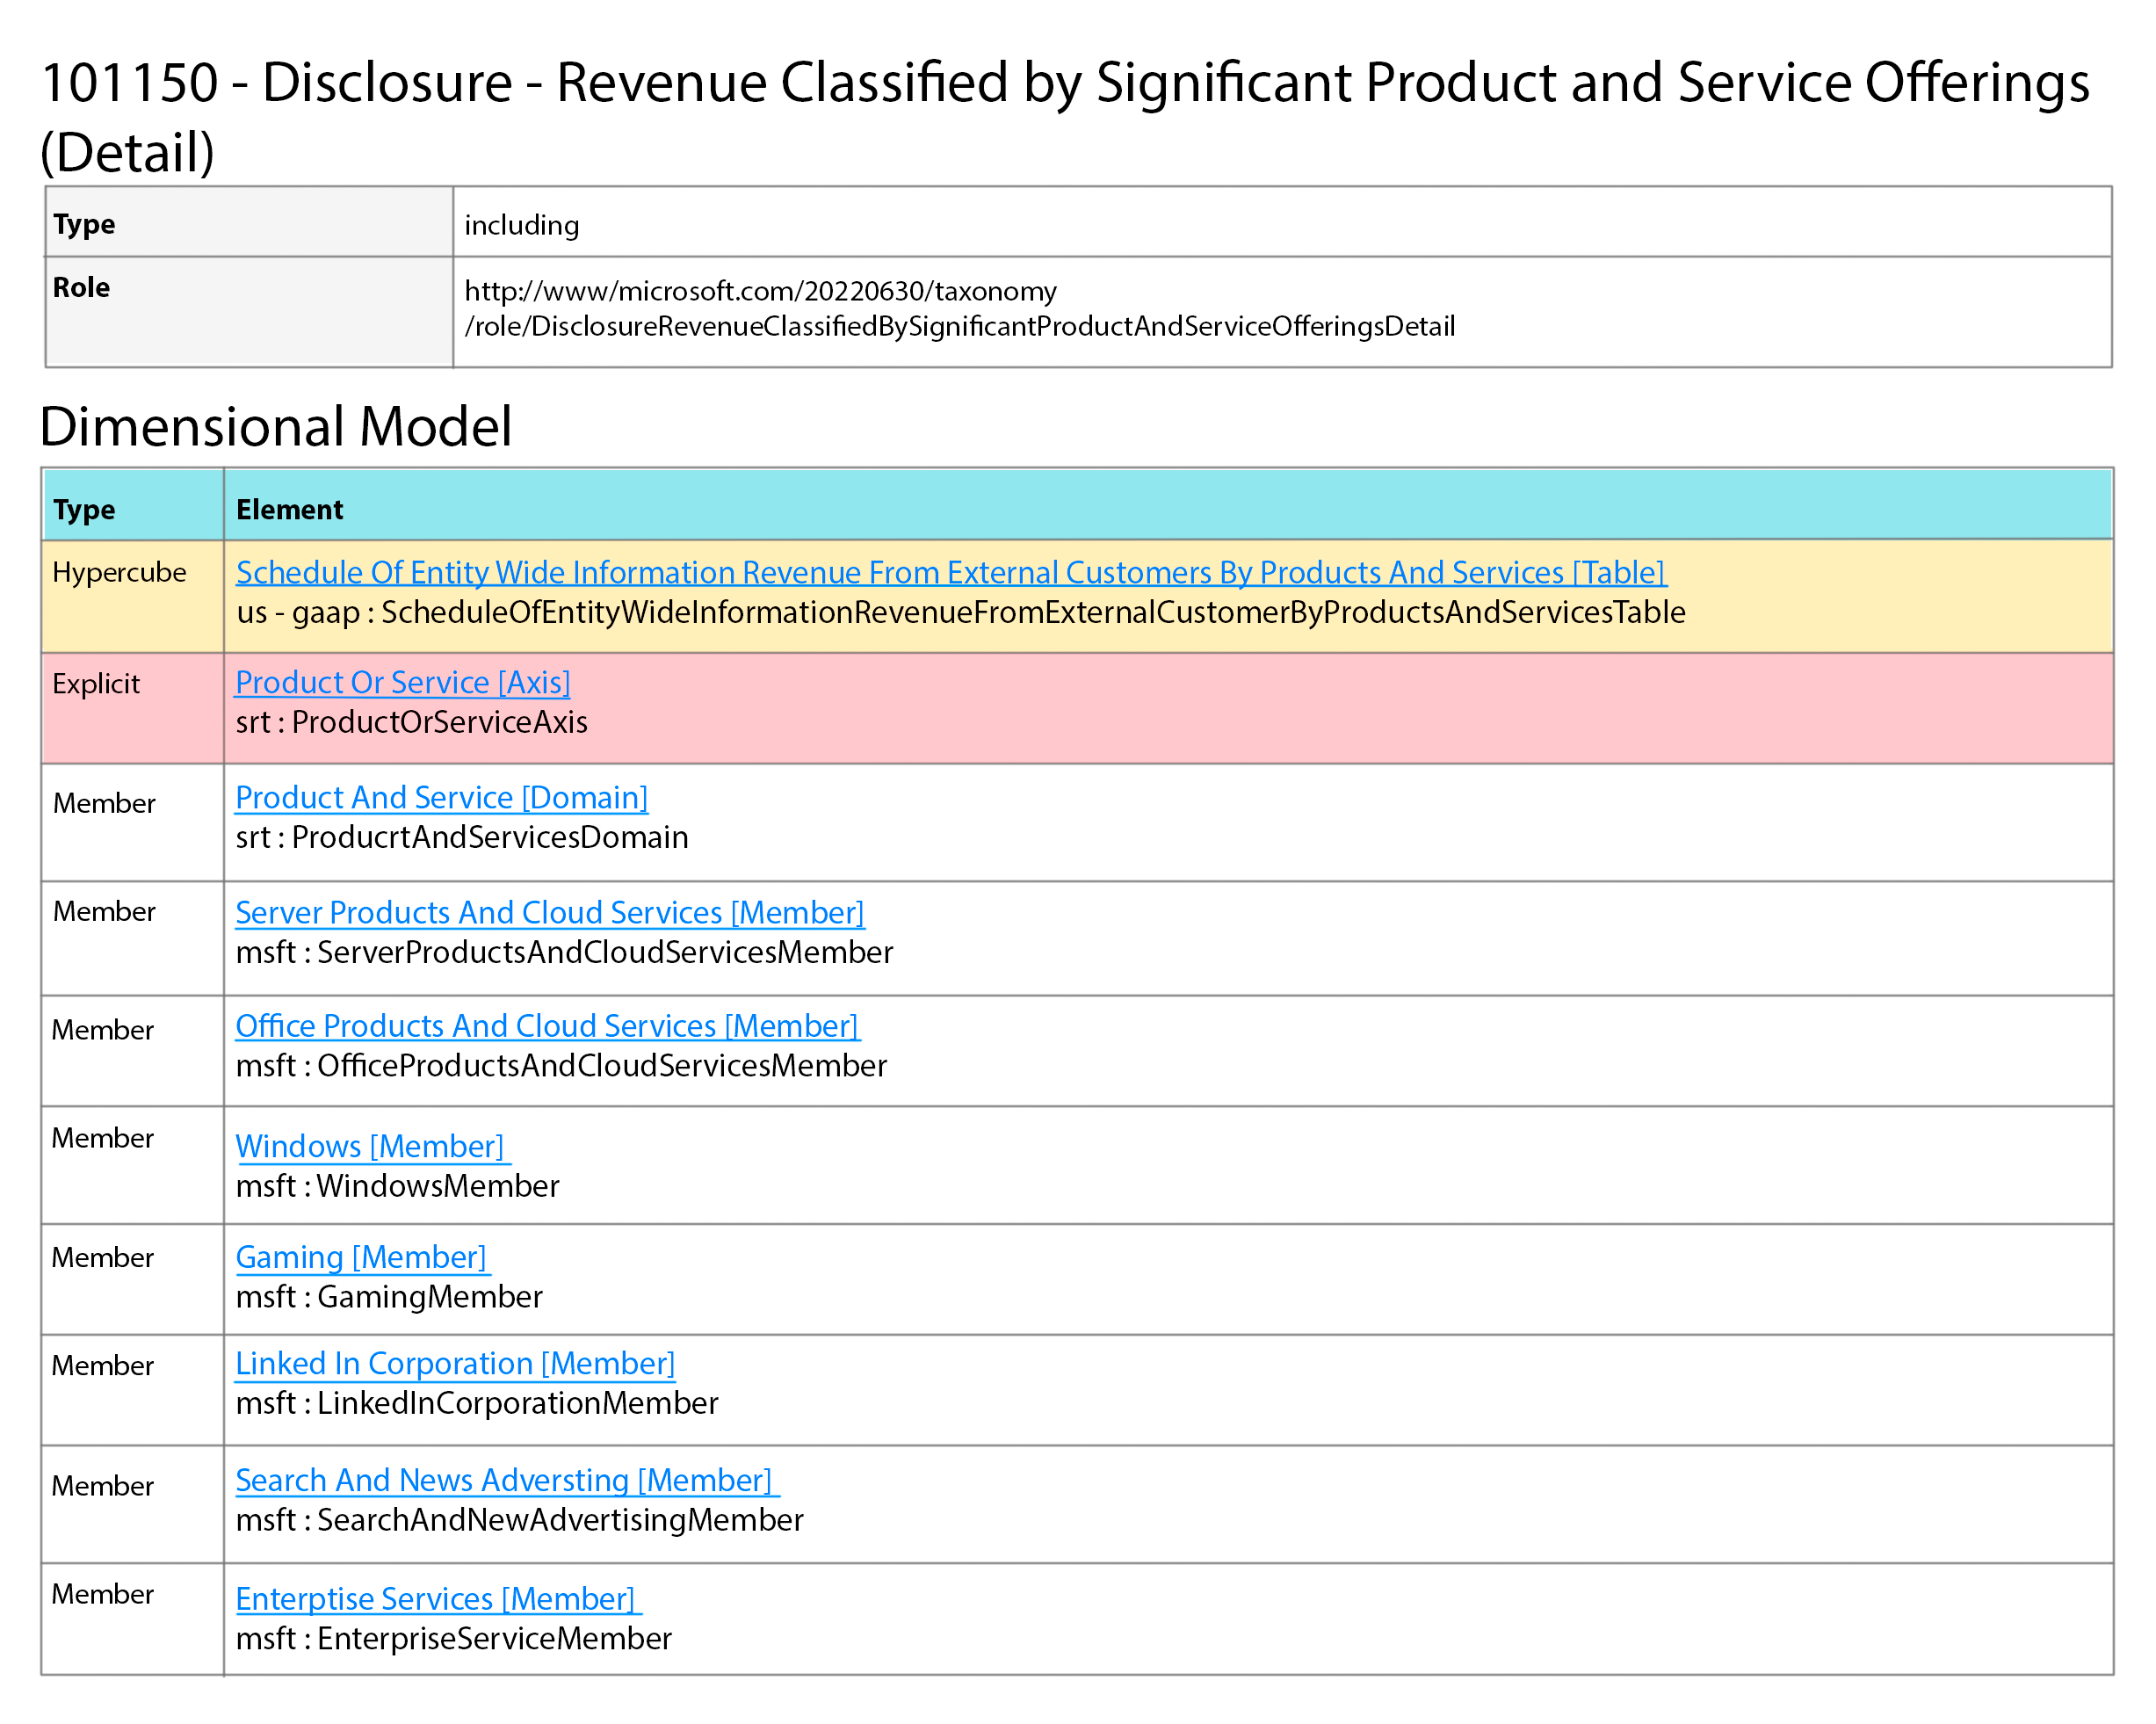
In XBRL reports, "hypercube" is a term used to describe a combination of dimensions. A hypercube contains information about a specific category of data, such as revenue by geographic region or product. Each hypercube is identified by a "role", like http://www.apple.com/role/RevenueRecognitionNetSalesDisaggregatedbySignificantProductsandServicesDetails.
The Sec-xbrl system has a JSON API that businesses can use to access segmentation information. This information is stored in different tables depending on how it's segmented - either by product or geographic region.
The API has two ways to represent the information: "full" and "simplified". The full representation includes all the dimension names and all the levels of nesting between dimensions and their members.
By using this API, businesses can easily analyze their segmentation data and make informed decisions.
In this instance, the JSON fragment contains data from three different hypercubes:
{
"2022-06-30": {
"Revenue From Contract With Customer Excluding Assessed Tax": {
"Product Or Service": {
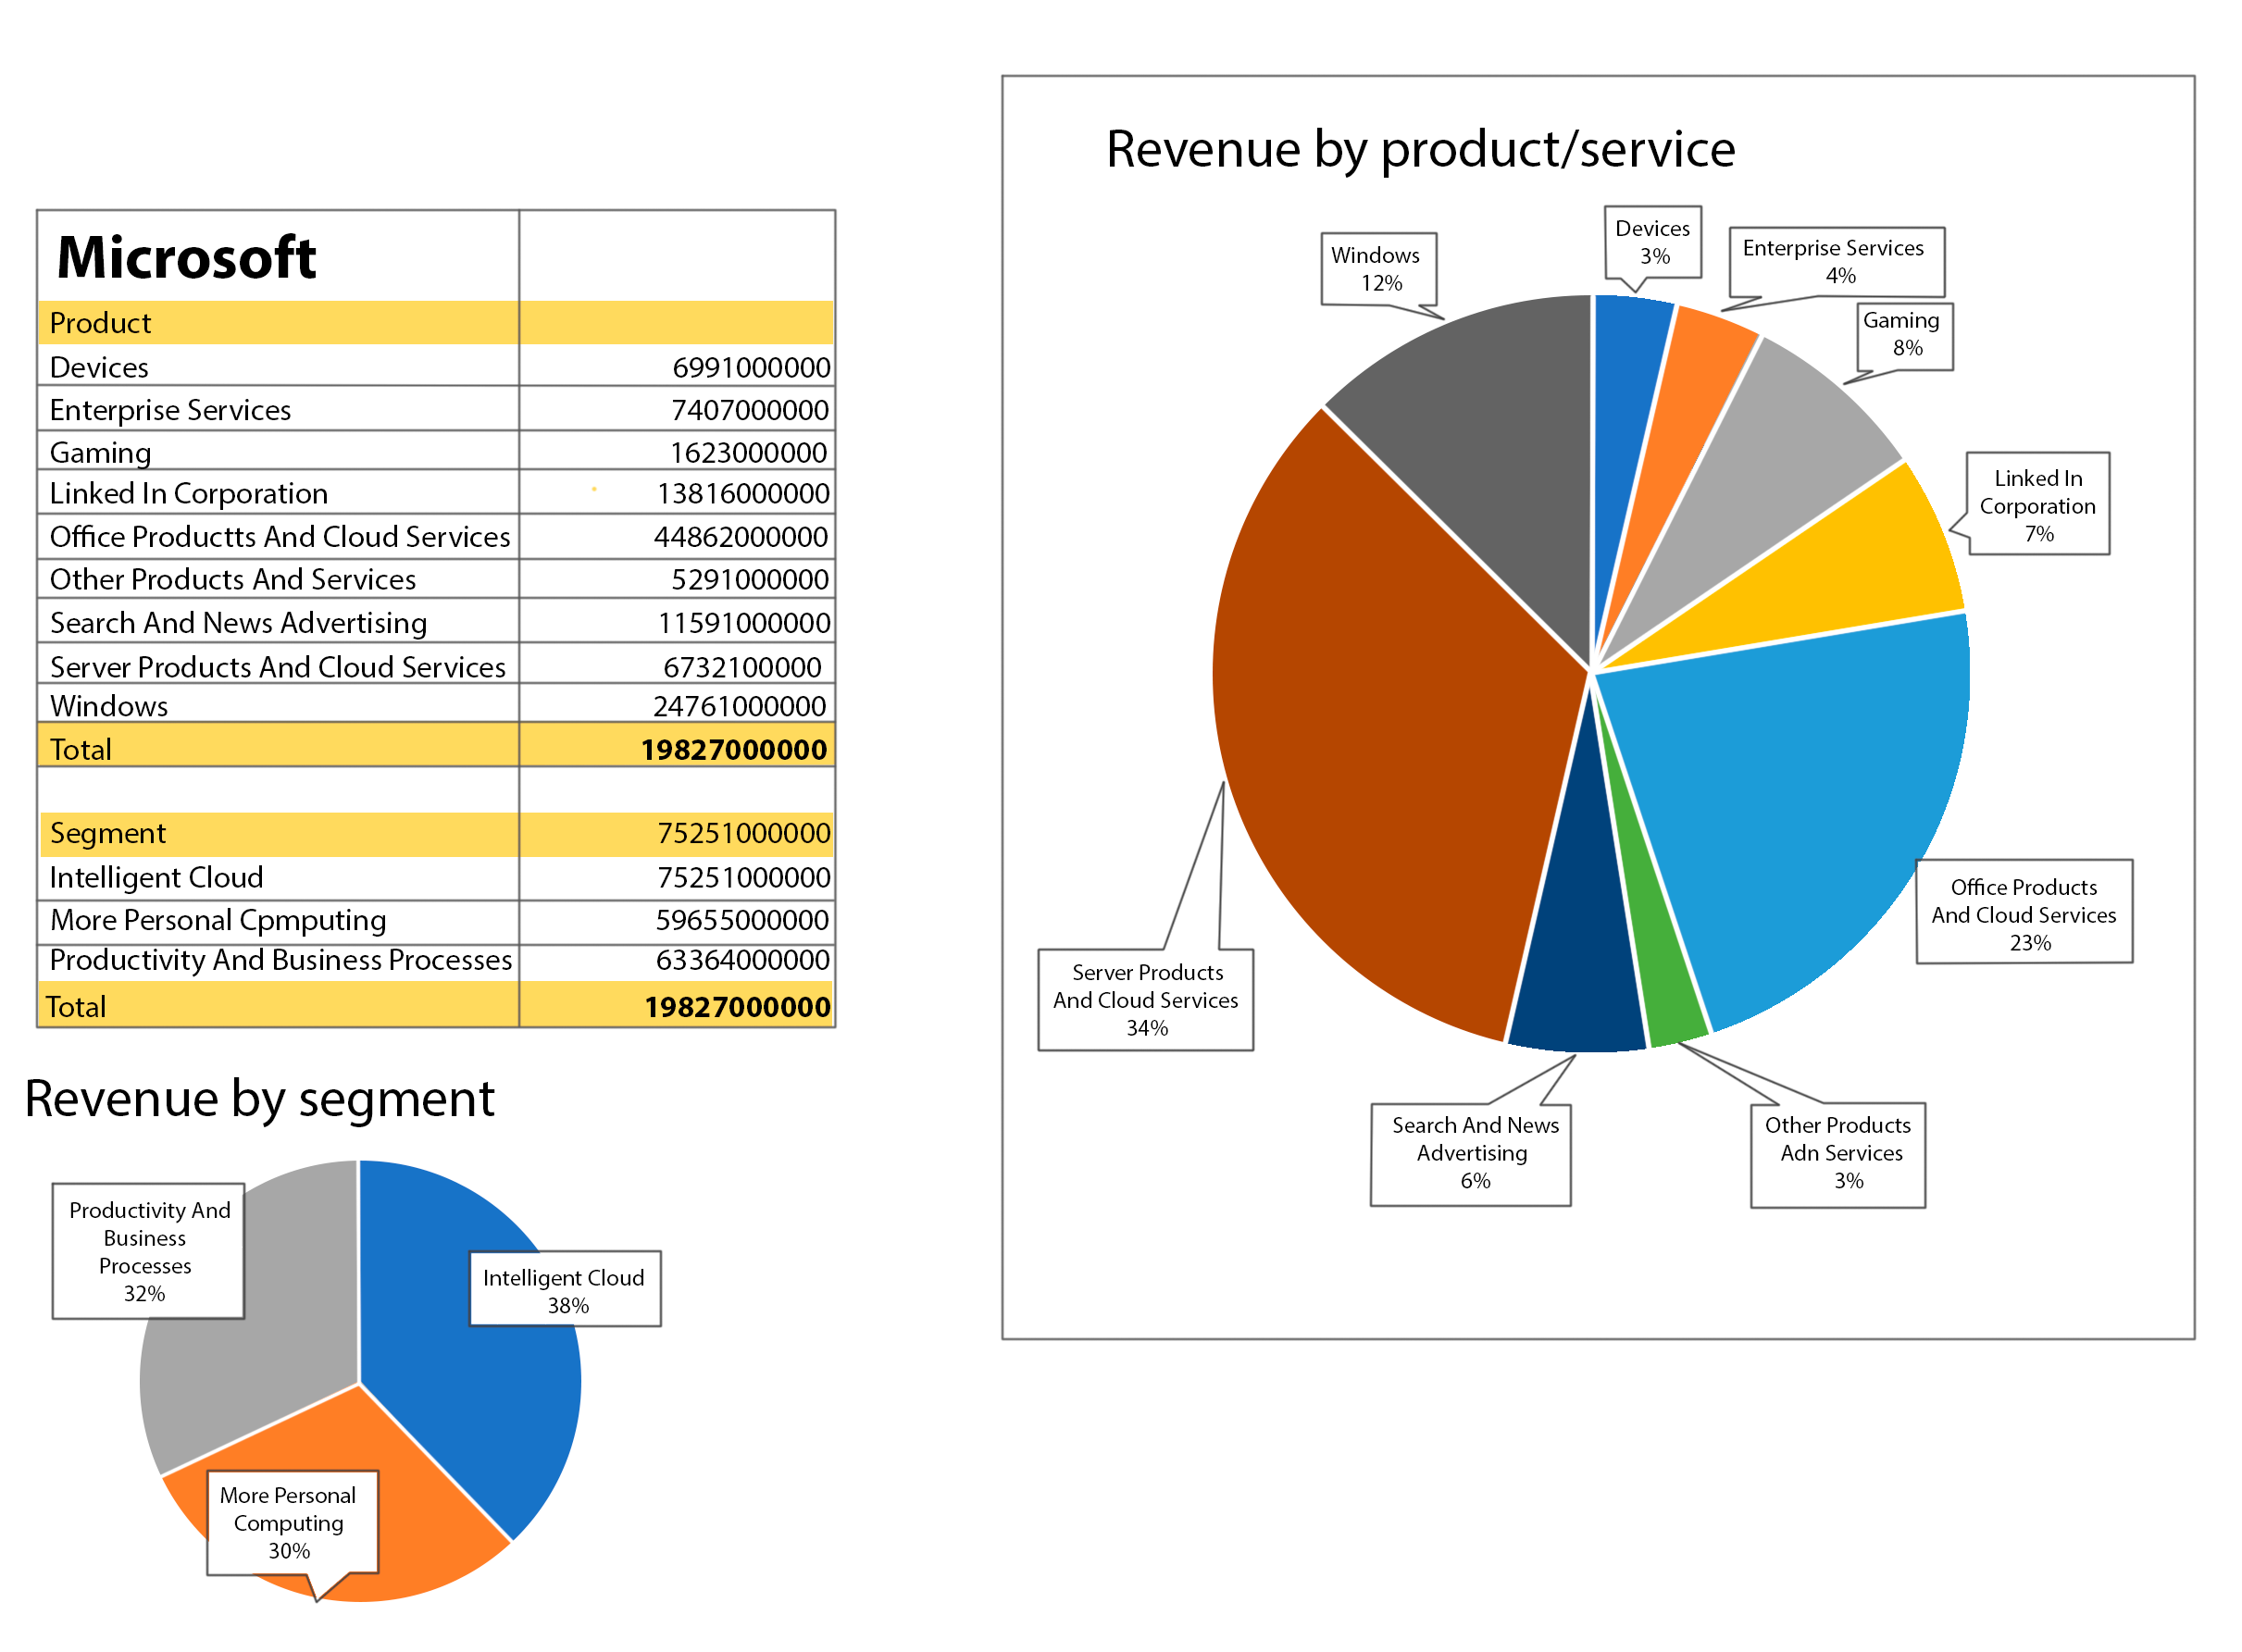
"Devices": 6991000000,
"Enterprise Services": 7407000000,
"Gaming": 16230000000,
"Linked In Corporation": 13816000000,
"Office Products And Cloud Services": 44862000000,
"Other Products And Services": 5291000000,
"Search And News Advertising": 11591000000,
"Server Products And Cloud Services": 67321000000,
"Windows": 24761000000
},
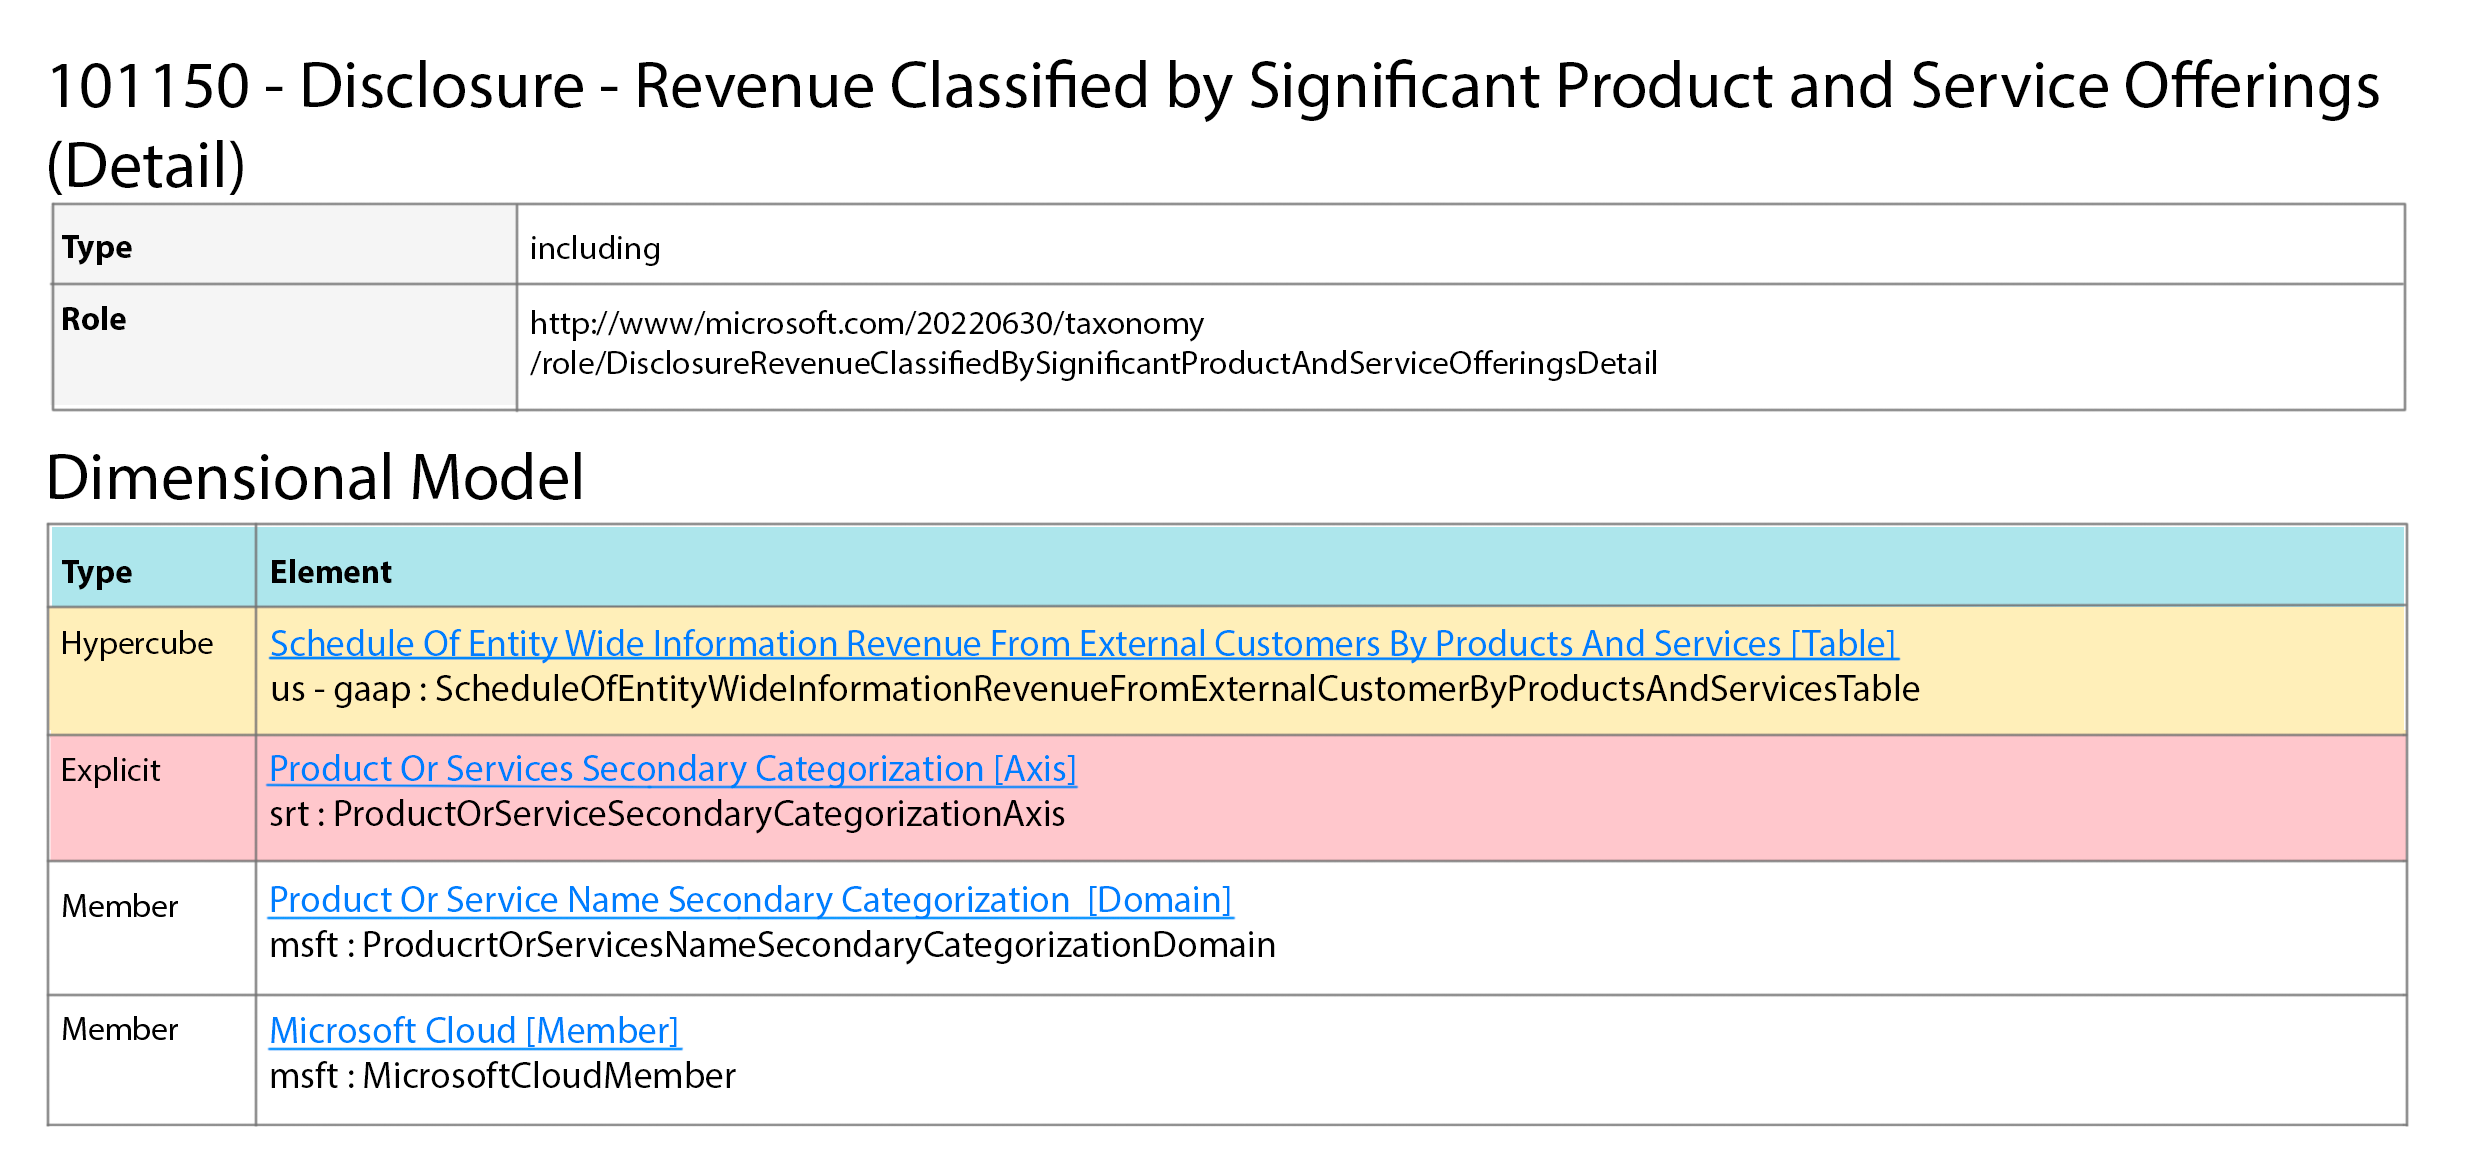
"Products Or Services Secondary Categorization": {
"Microsoft Cloud": 91200000000
},
"Statement Business Segments": {
"Intelligent Cloud": 75251000000,
"More Personal Computing": 59655000000,
"Productivity And Business Processes": 63364000000
}
}
}
}
http://www.microsoft.com/20220630/taxonomy/role/DisclosureRevenueClassifiedBySignificantProductAndServiceOfferingsDetail
http://www.microsoft.com/20220630/taxonomy/role/DisclosureRevenueClassifiedBySignificantProductAndServiceOfferingsParentheticalDetail
http://www.microsoft.com/20220630/taxonomy/role/DisclosureSegmentRevenueDetail
Each box has a different size, with one dimension having a certain number of things inside it. The total amount of information connected to the things in one box should be the same as the information in another box.
In this example, the information in the first and third boxes is equal, and together they add up to the total money earned:
{
		"2022-06-30": {
			"Devices": 6991000000,
			"Enterprise Services": 7407000000,
			"Gaming": 16230000000,
			"Linked In Corporation": 13816000000,
			"Office Products And Cloud Services": 44862000000,
			"Other Products And Services": 5291000000,
			"Search And News Advertising": 11591000000,
			"Server Products And Cloud Services": 67321000000,
			"Windows": 24761000000
		}
	}
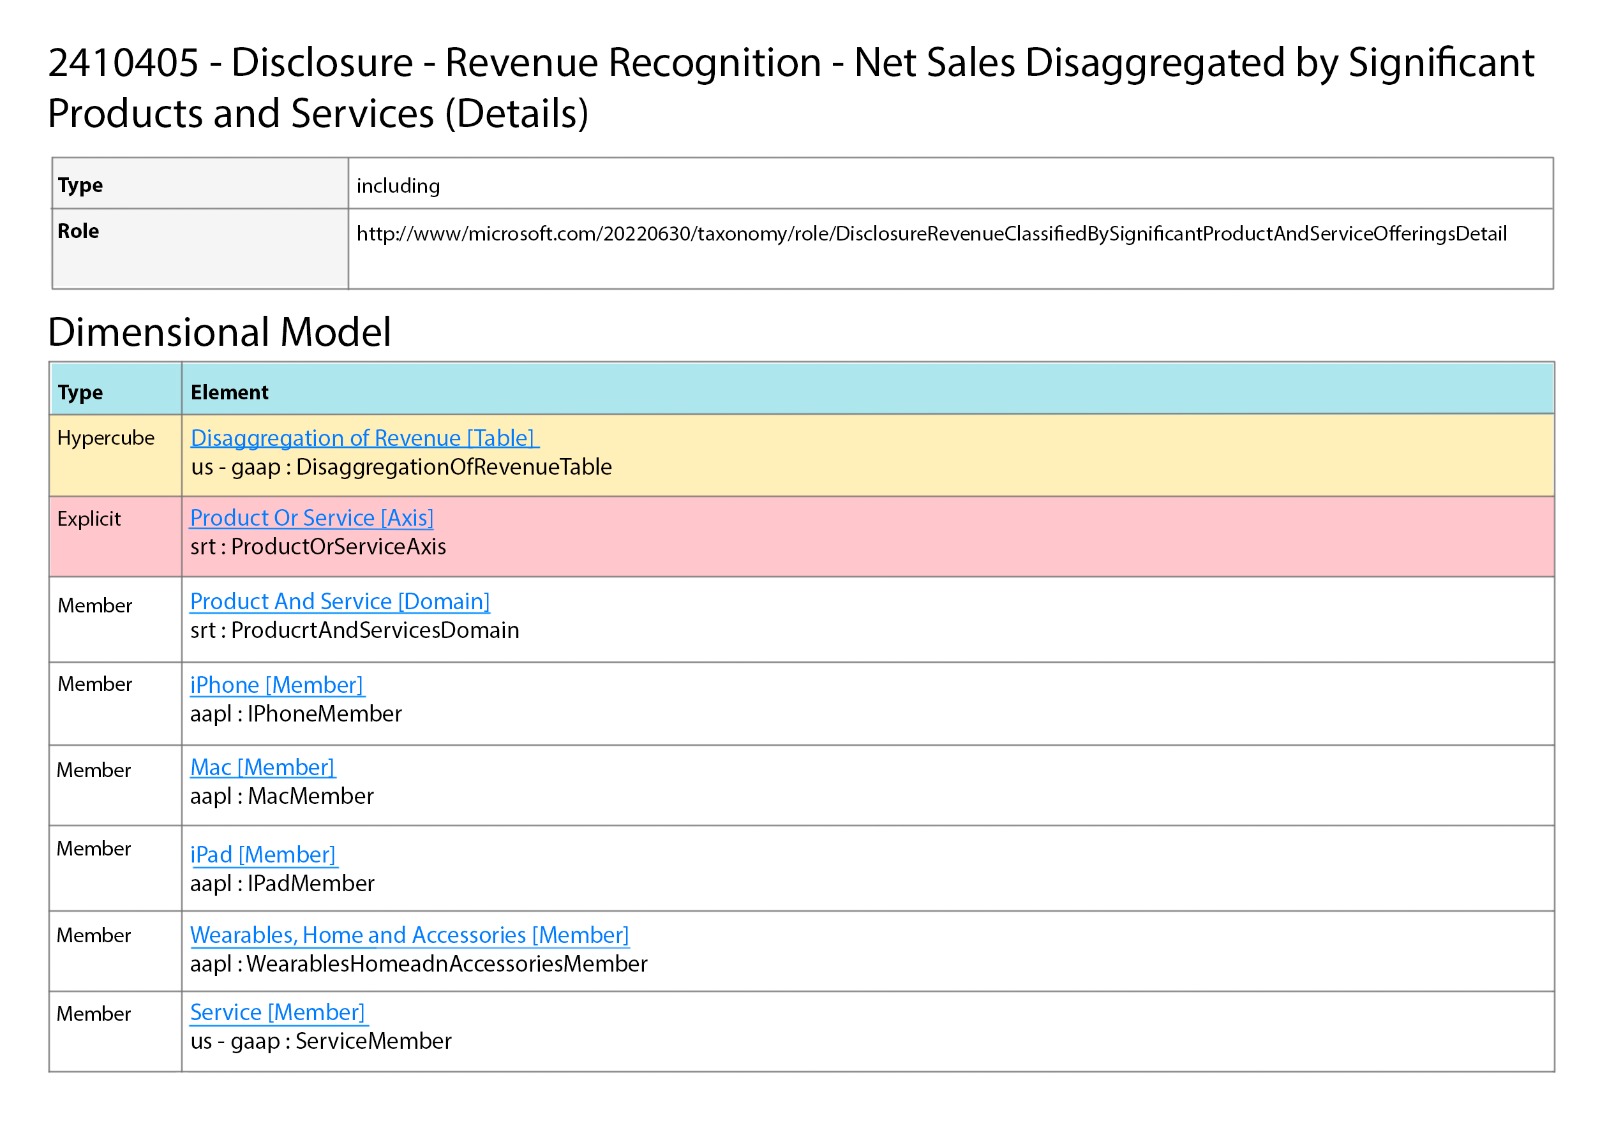
We are required to choose one of the hypercubes, and the rule is to select the hypercube with the highest number of members. The rationale behind this is that it provides a more detailed view of the fact values. It's possible for two hypercubes to have the same dimension but different identifiers and members.
An example of this can be seen in the financial filing provided in the link:
https://www.sec.gov/Archives/edgar/data/320193/000032019321000105/aapl-20210925_htm.xml,
Where two hypercubes report facts with different members but the same dimension, specifically the "RevenueRecognitionNetSalesDisaggregatedbySignificantProductsandServicesDetails" role.
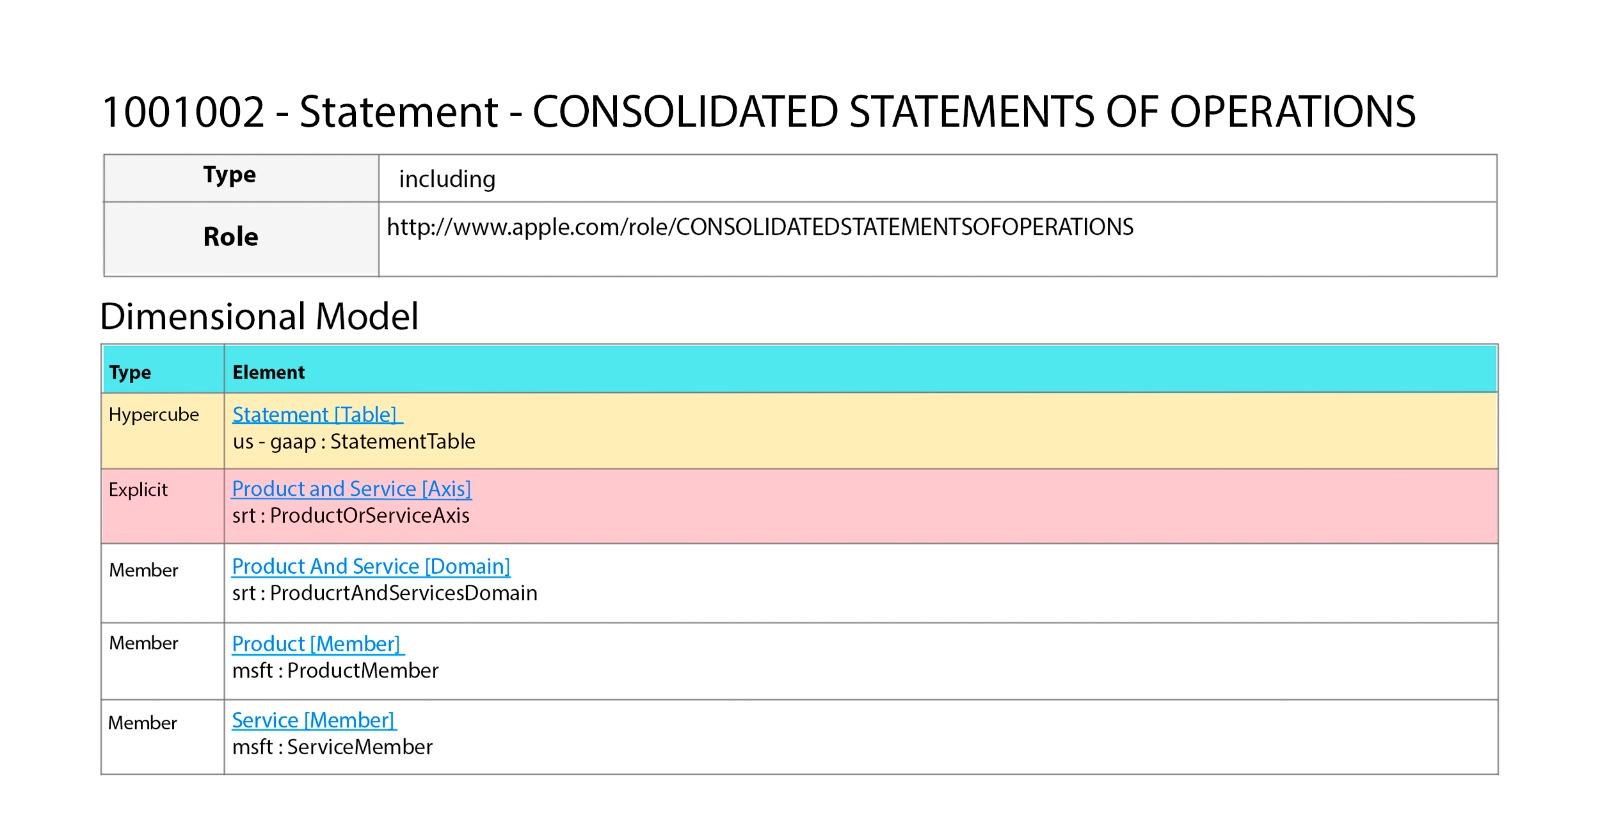
http://www.apple.com/role/CONSOLIDATEDSTATEMENTSOFOPERATIONS
{
	"2021-09-25": {
		"Mac": 35190000000,
		"Product": 297392000000,
		"Service": 68425000000,
		"Wearables, Home and Accessories": 38367000000,
		"iPad": 31862000000,
		"iPhone": 191973000000
	}
}
To solve the problem, we need to remove the "Product" line from the information because it's repeated in the other four lines.
297392000000 = 35190000000 + 38367000000 + 31862000000 + 191973000000
In a program called process_metrics_direct.py, we sometimes need to add up certain facts that belong to a certain category. We use a process to make sure that the total of these facts matches up with the actual total.
Imagine you have a basket of apples, oranges, and bananas. You want to count how many fruits you have in total. You can use a process to make sure that your count matches up with the actual total.
Similarly, in the program process_metrics_direct.py, you might have data for different types of products, like cars, bikes, and trucks. You want to add up the sales numbers for each product to get the total sales. You use a process to make sure that your total sales number matches up with the actual total sales number.
1. If there is a total fact that doesn't have any extra categories, we show its value in a JSON format.
2. If there is no total fact, but we have a combination of numbers and categories that matches a standard category name, we add up all the numbers and display the total for that standard category.
You will receive the information that help to do investments.
Note: Check the spam folder if you don't receive an email.