Takeaway number 1: Balance Sheet and the Income Statement
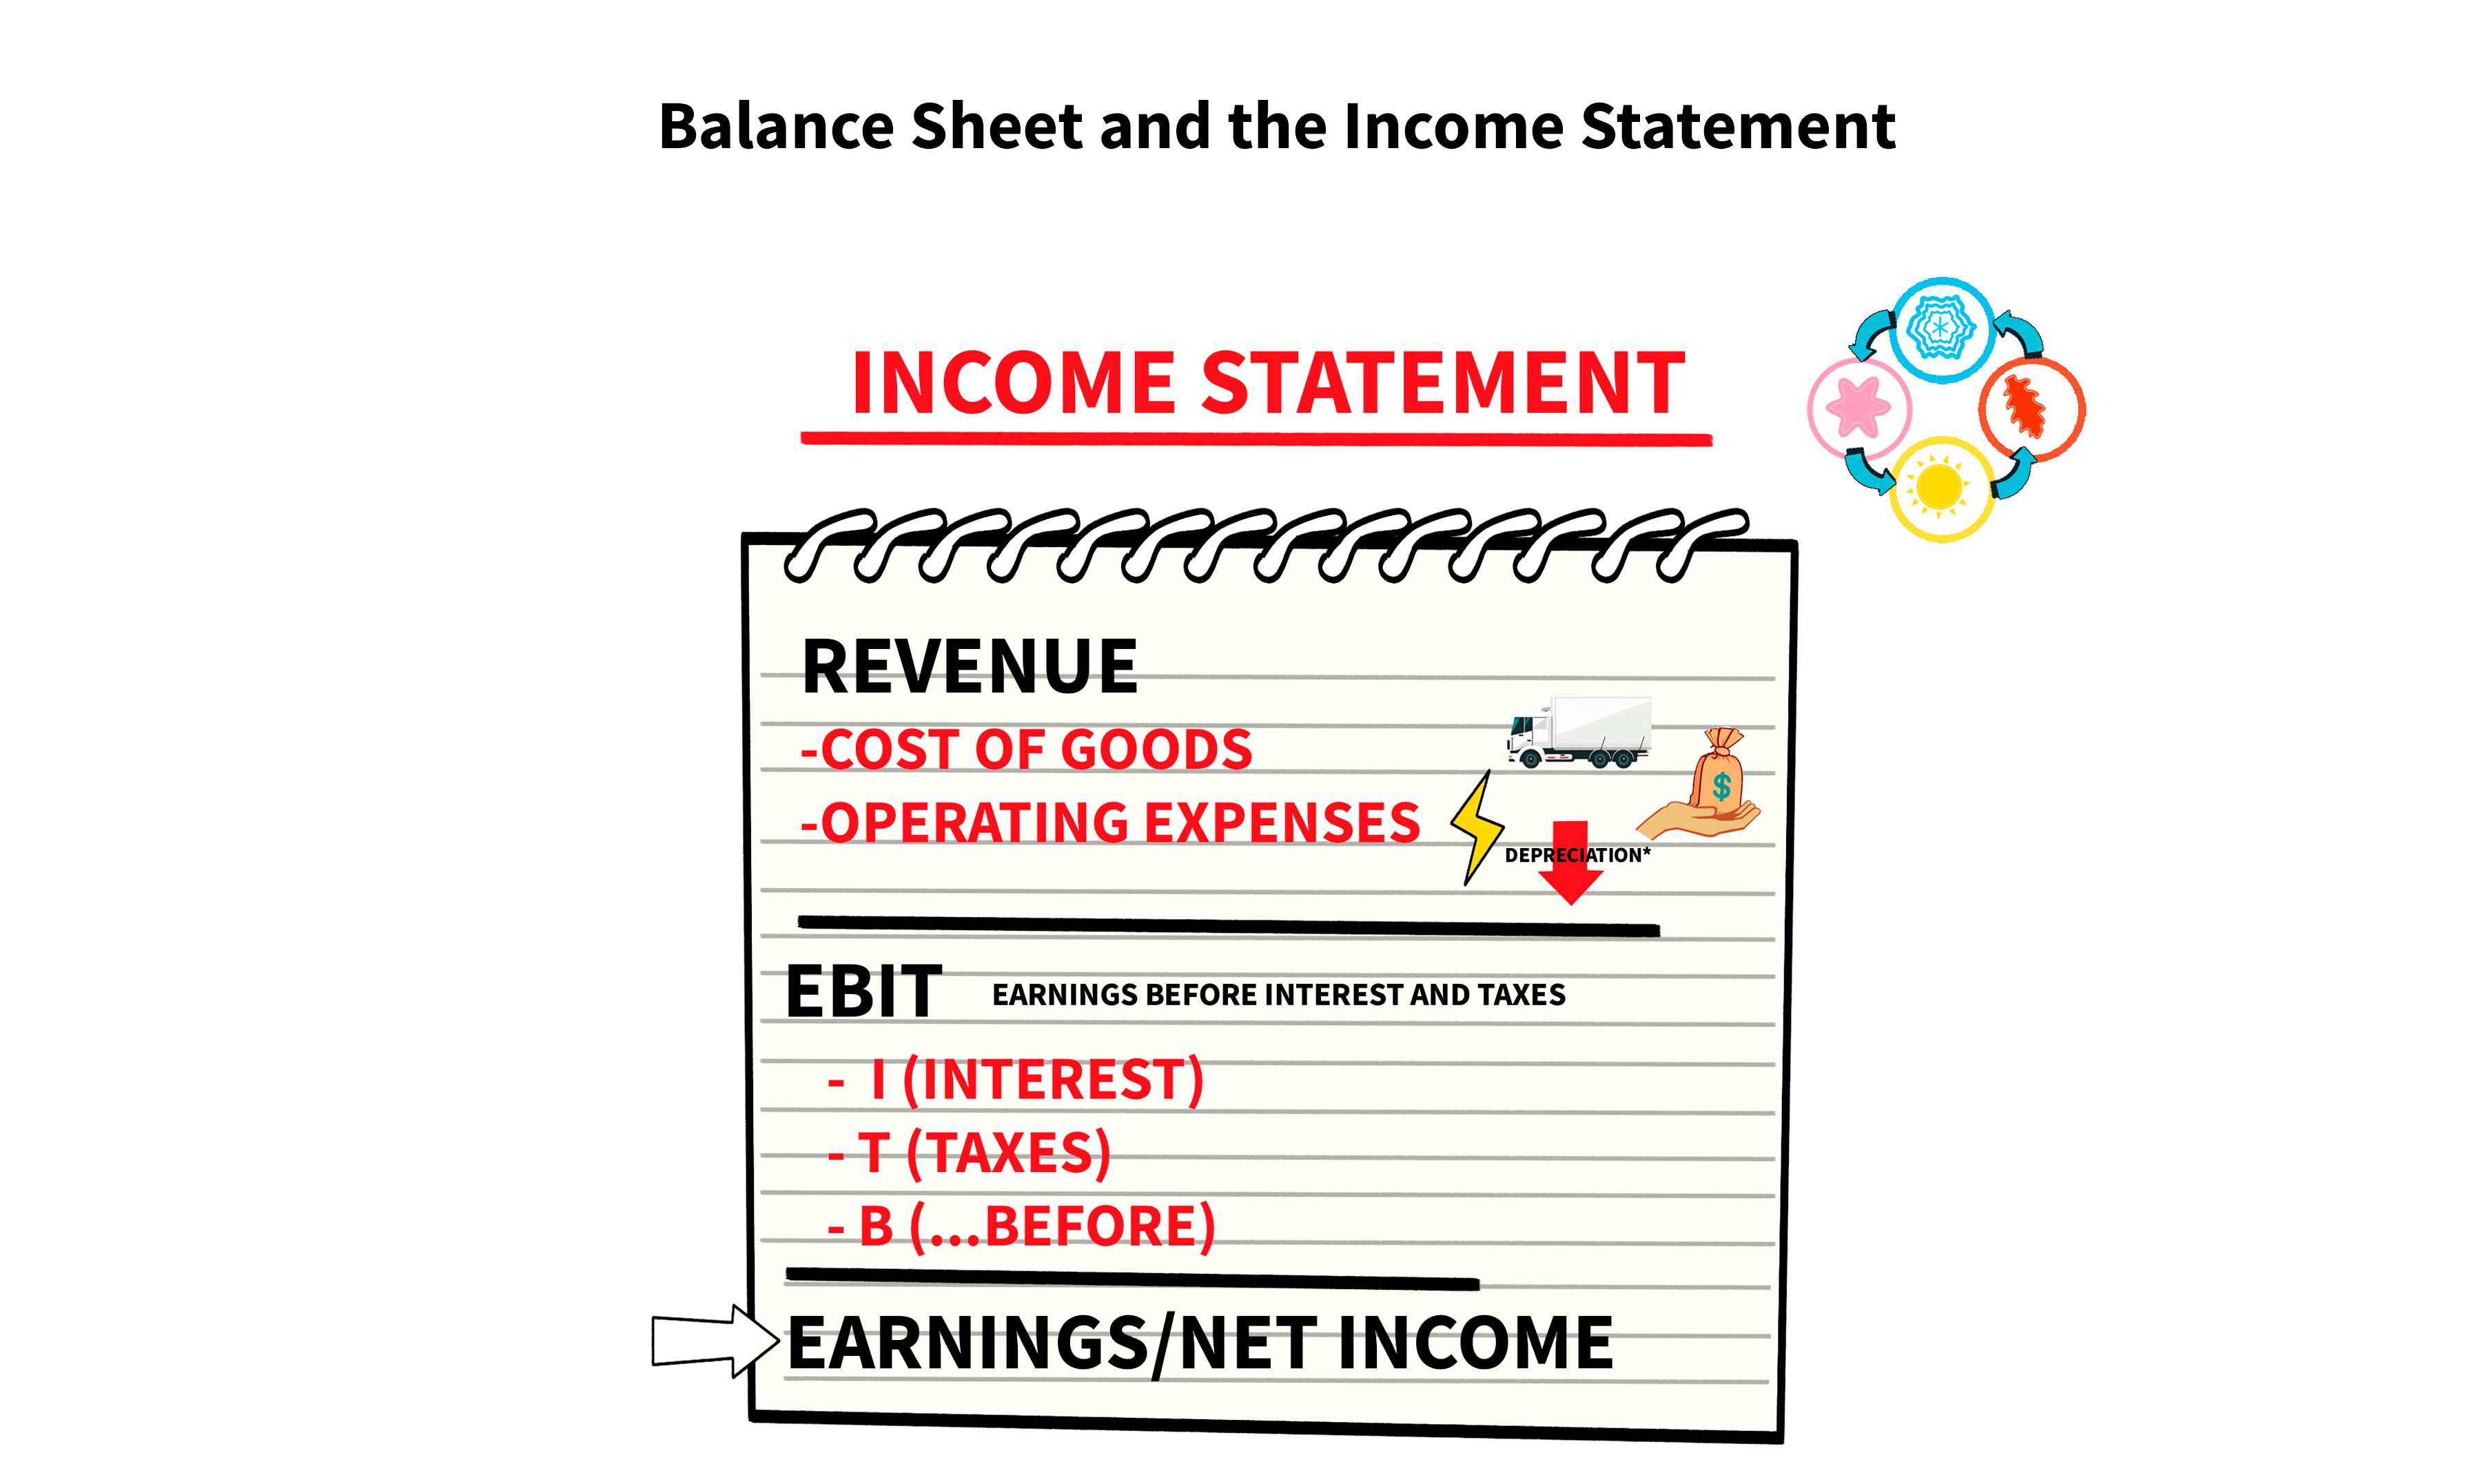
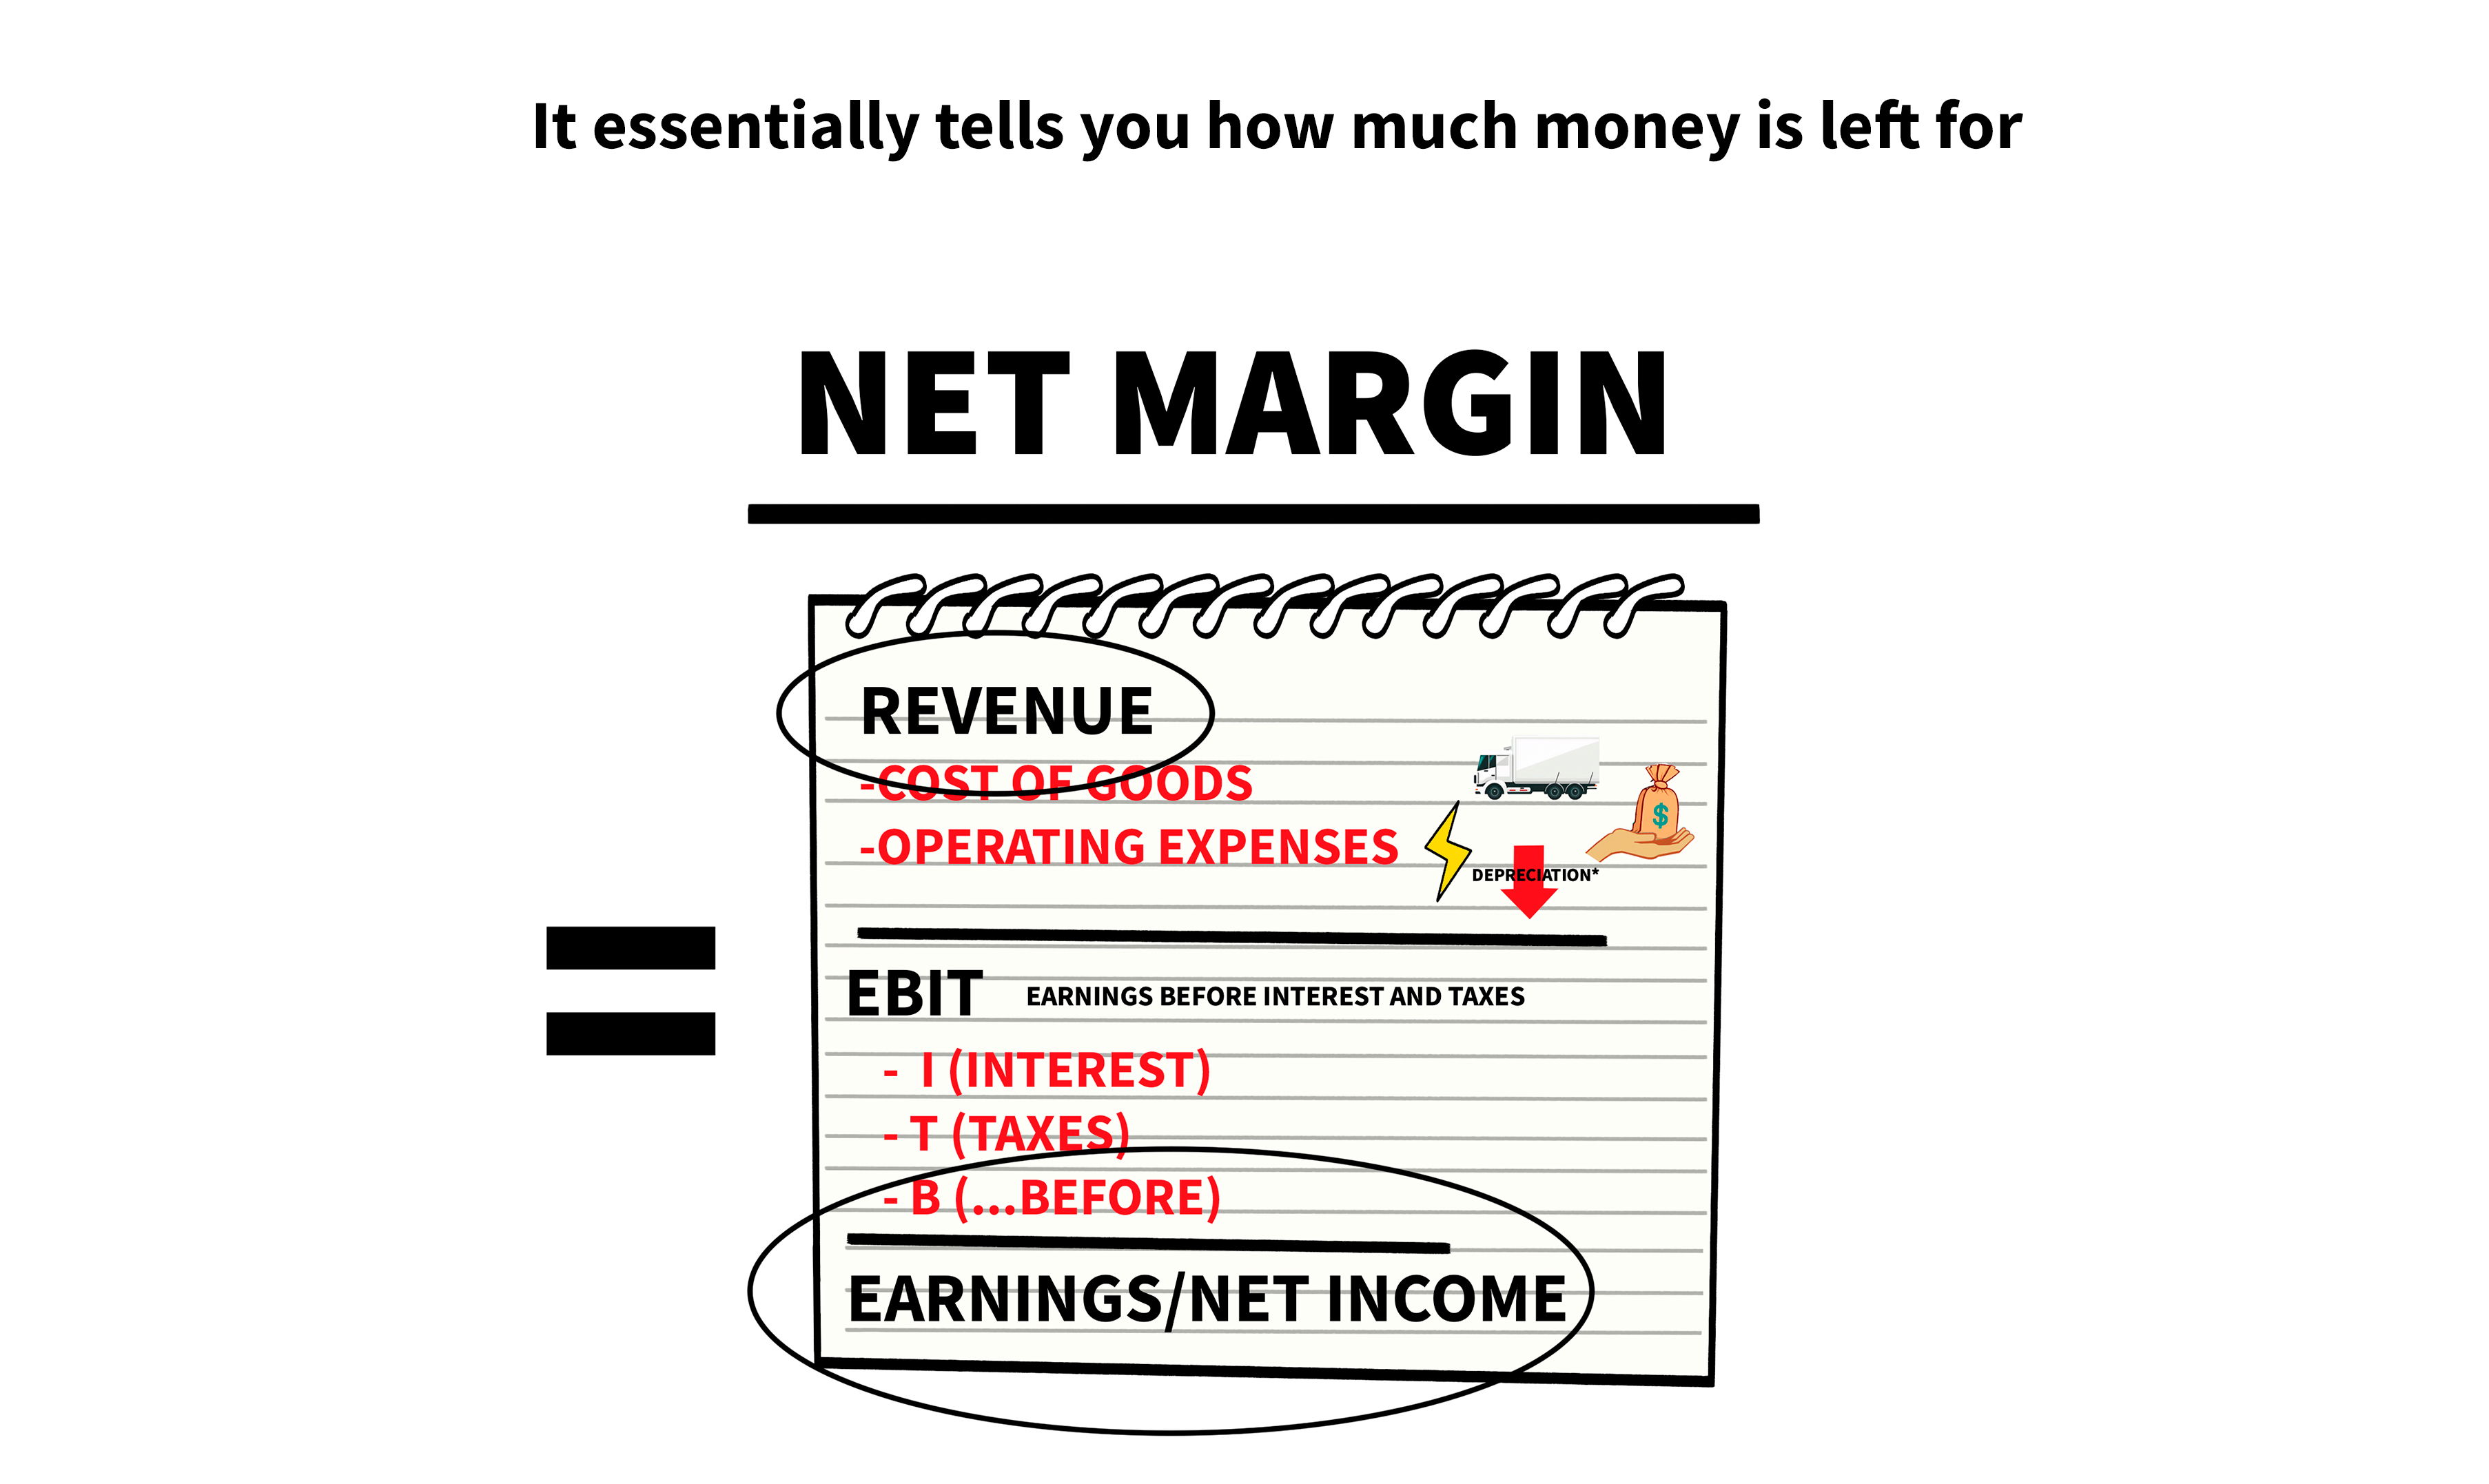
The income statement analyzes a company's revenues and expenses over a specific time period, typically a quarter or a year. The revenue statement is followed by the earnings or net income statement of the company. In most cases, the cost of goods is deducted first. After deducting other operating expenses such as wages, transportation, utilities, and depreciation, the operating income, or EBIT, is calculated. If we subtract debt interest payments and give the government a piece of the cake, and we remove the "before" because it is now "after," we get earnings or net income.
What is Balance Sheet?
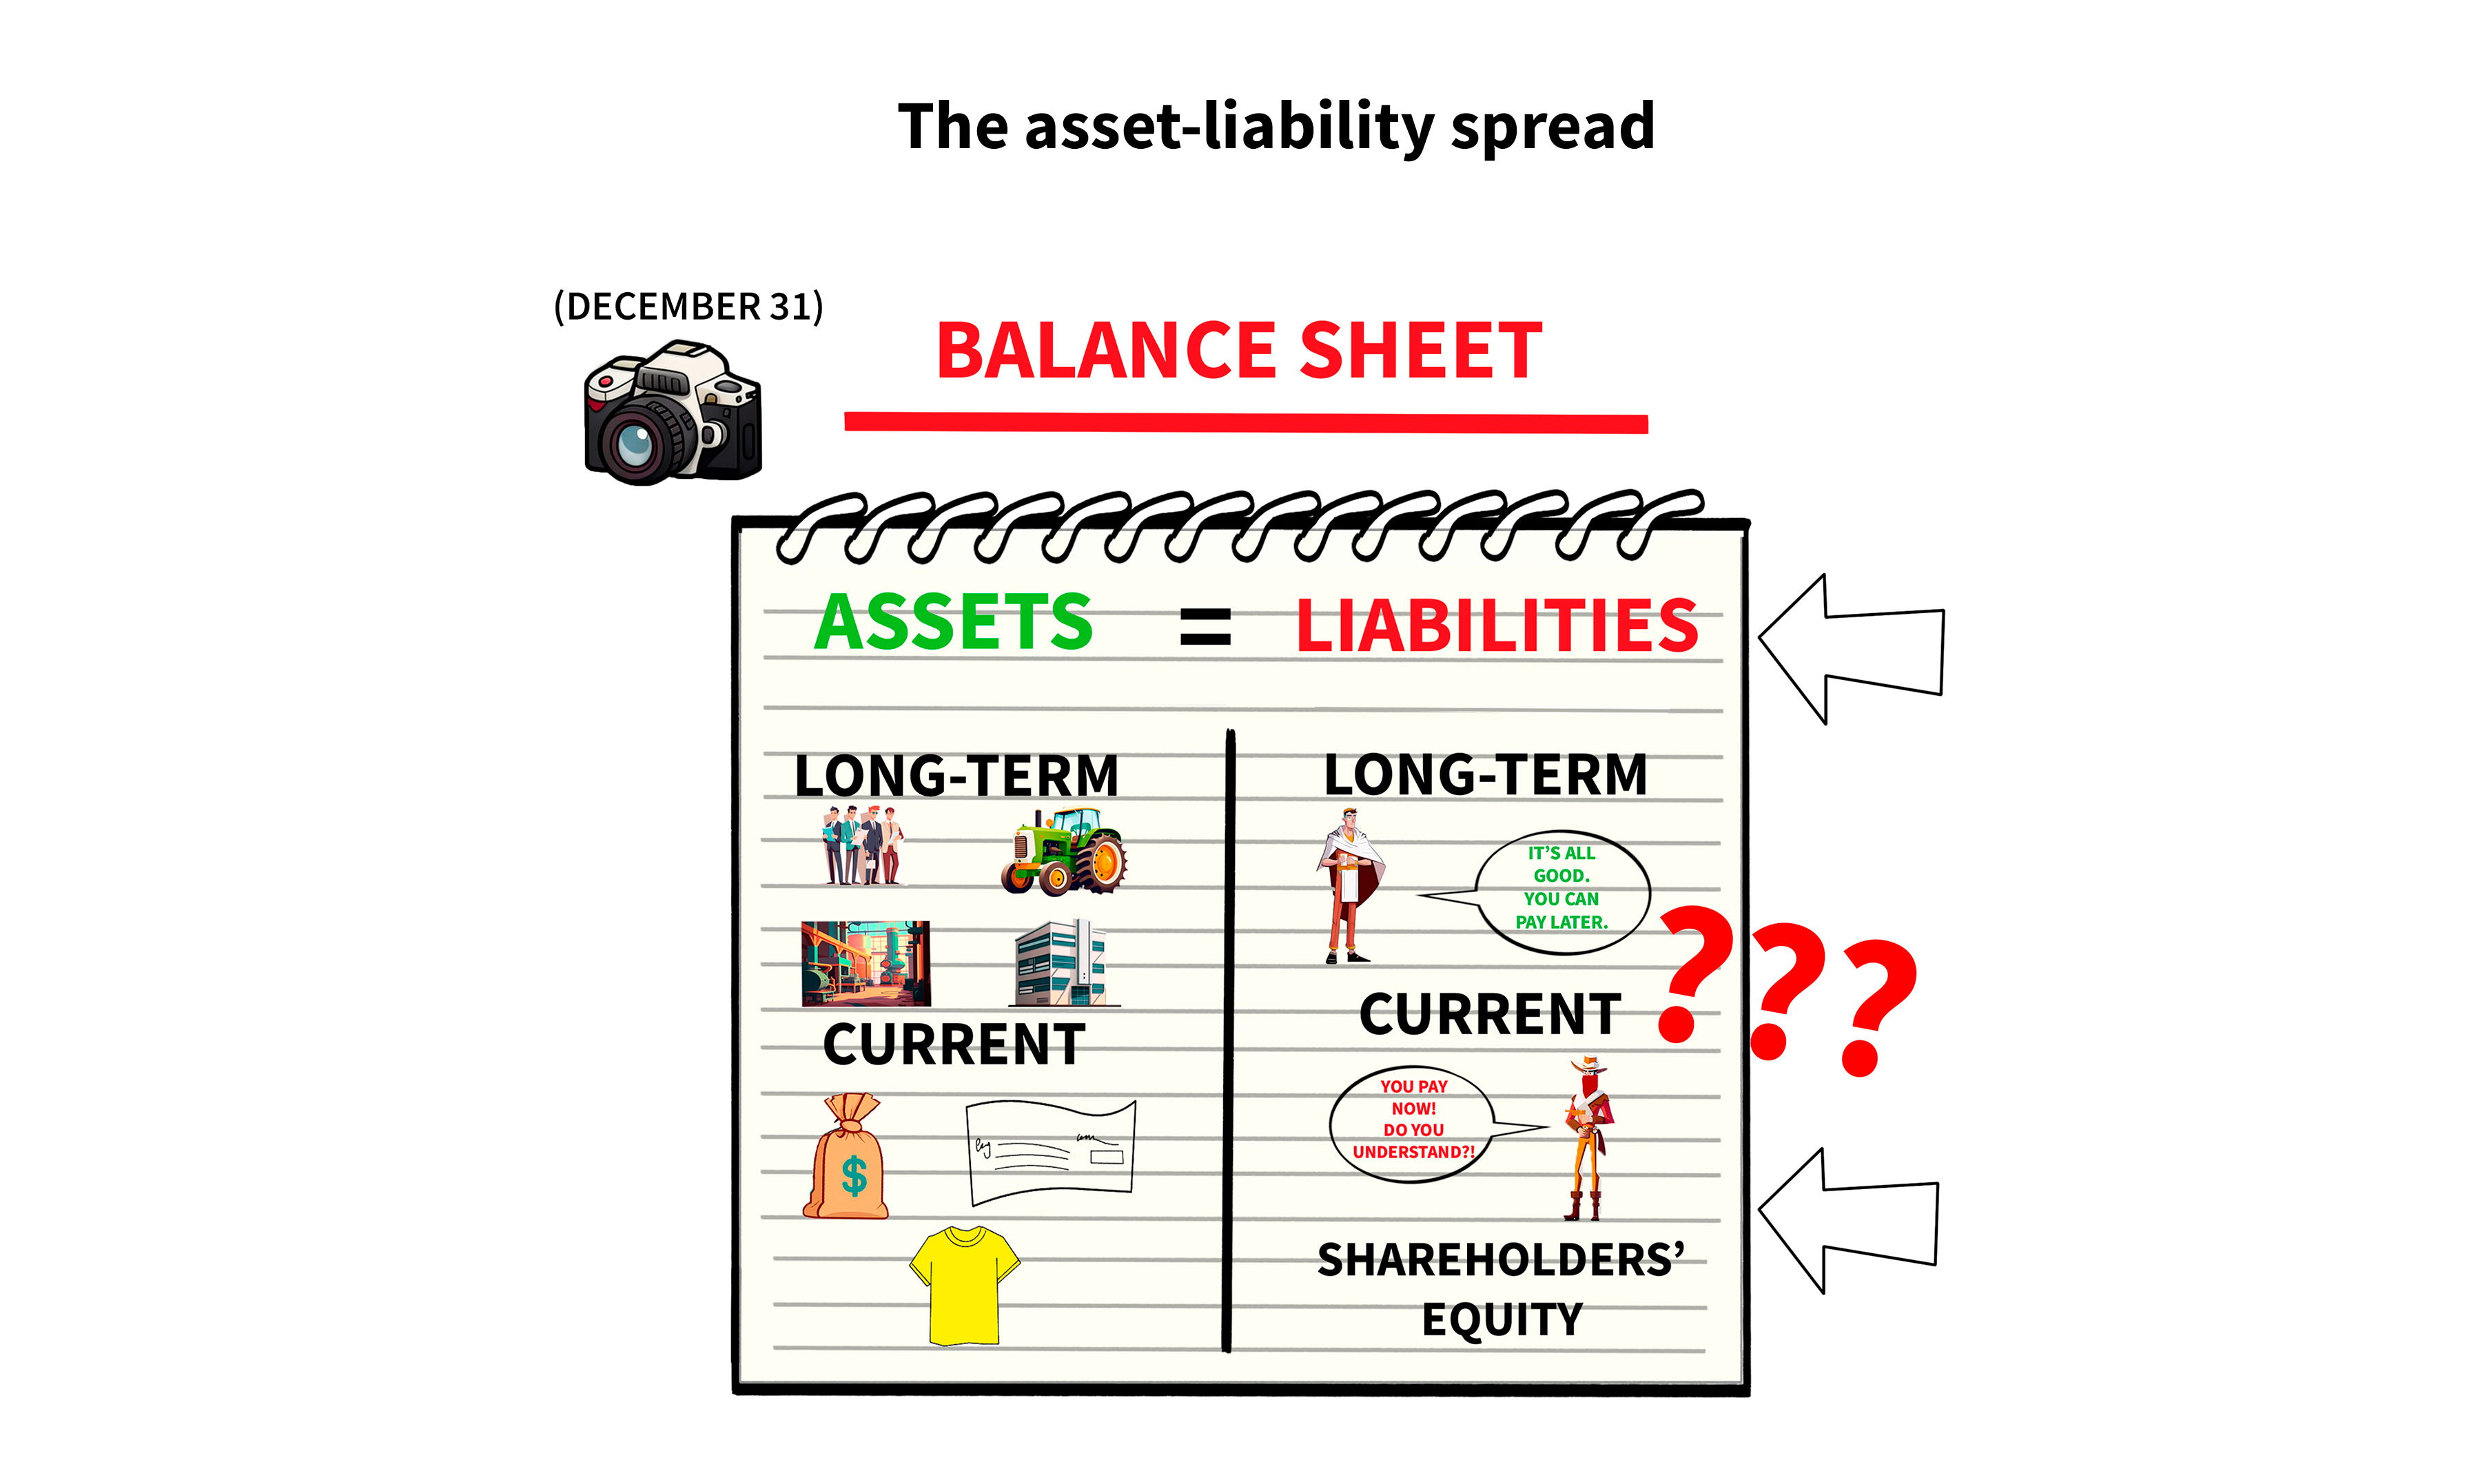
The balance sheet is a snapshot in time, typically December 31st, that depicts two sides that must always "balance out" - how much a company owns and how much it owes. What it owns is displayed on the asset side. What it owes is shown on the liability side.
Long-term assets are classified into two types: Machinery, Real Estate, Production Plans, Intangibles, and Current Assets (or Short-Term). Examples include cash in the bank, liquid securities, and inventory. The liability side is divided into three sections: long-term liabilities, current liabilities, and shareholders' equity (money owned as a stock owner).
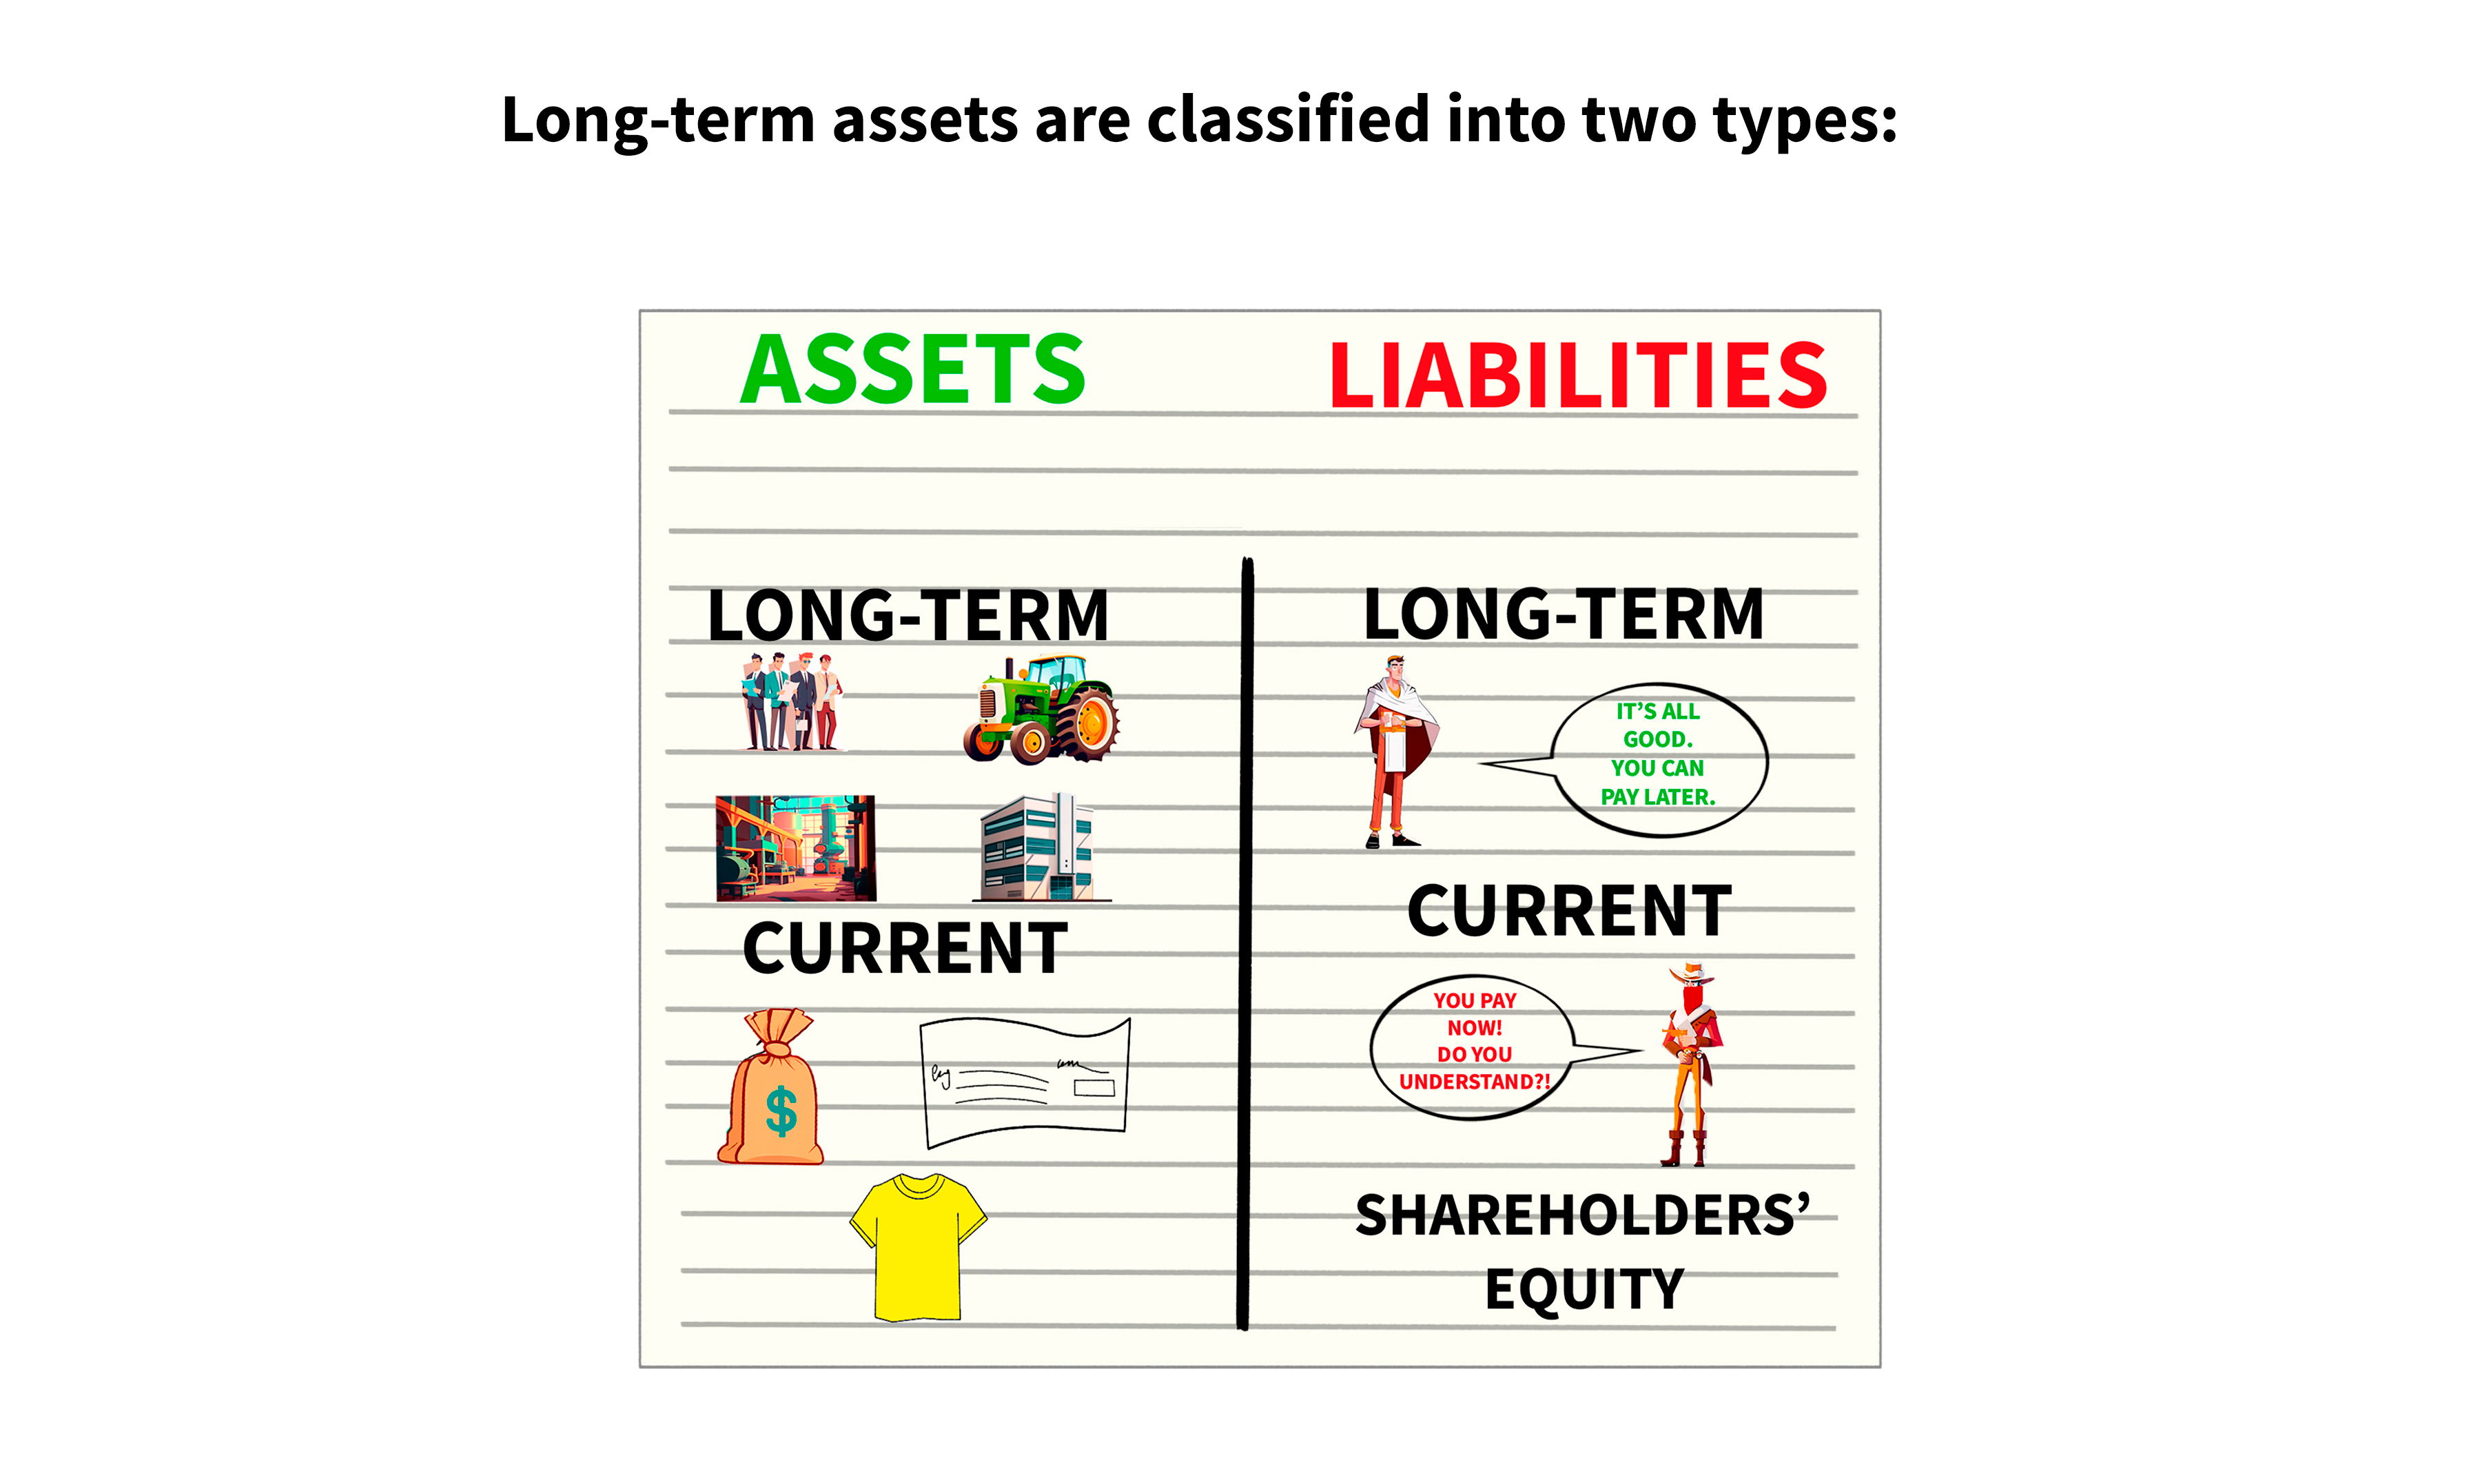
What the company owes you as a shareholder is known as shareholder equity. It is also referred to as the asset-liability spread. In essence, Assets = Liabilities (including shareholders' equity), resulting in Assets - Liabilities = Shareholders' interest. Your local accountant may dismiss this as mere technicalities, but as an investor, it is the most practical way to look at it.
Takeaway number 2: Industry Specifics
From these two statements, there are many useful indicators that you can calculate. Numbers that will help you in your fundamental analysis of a company. However, these numbers typically vary from one industry to the other.
What is Net Margin?
This indicator can be calculated by dividing a company's net income by its revenue. It essentially tells you how much money is left for potential reinvestment in the firm or distribution to shareholders per earned dollar in the firm (though this is a slight simplification).
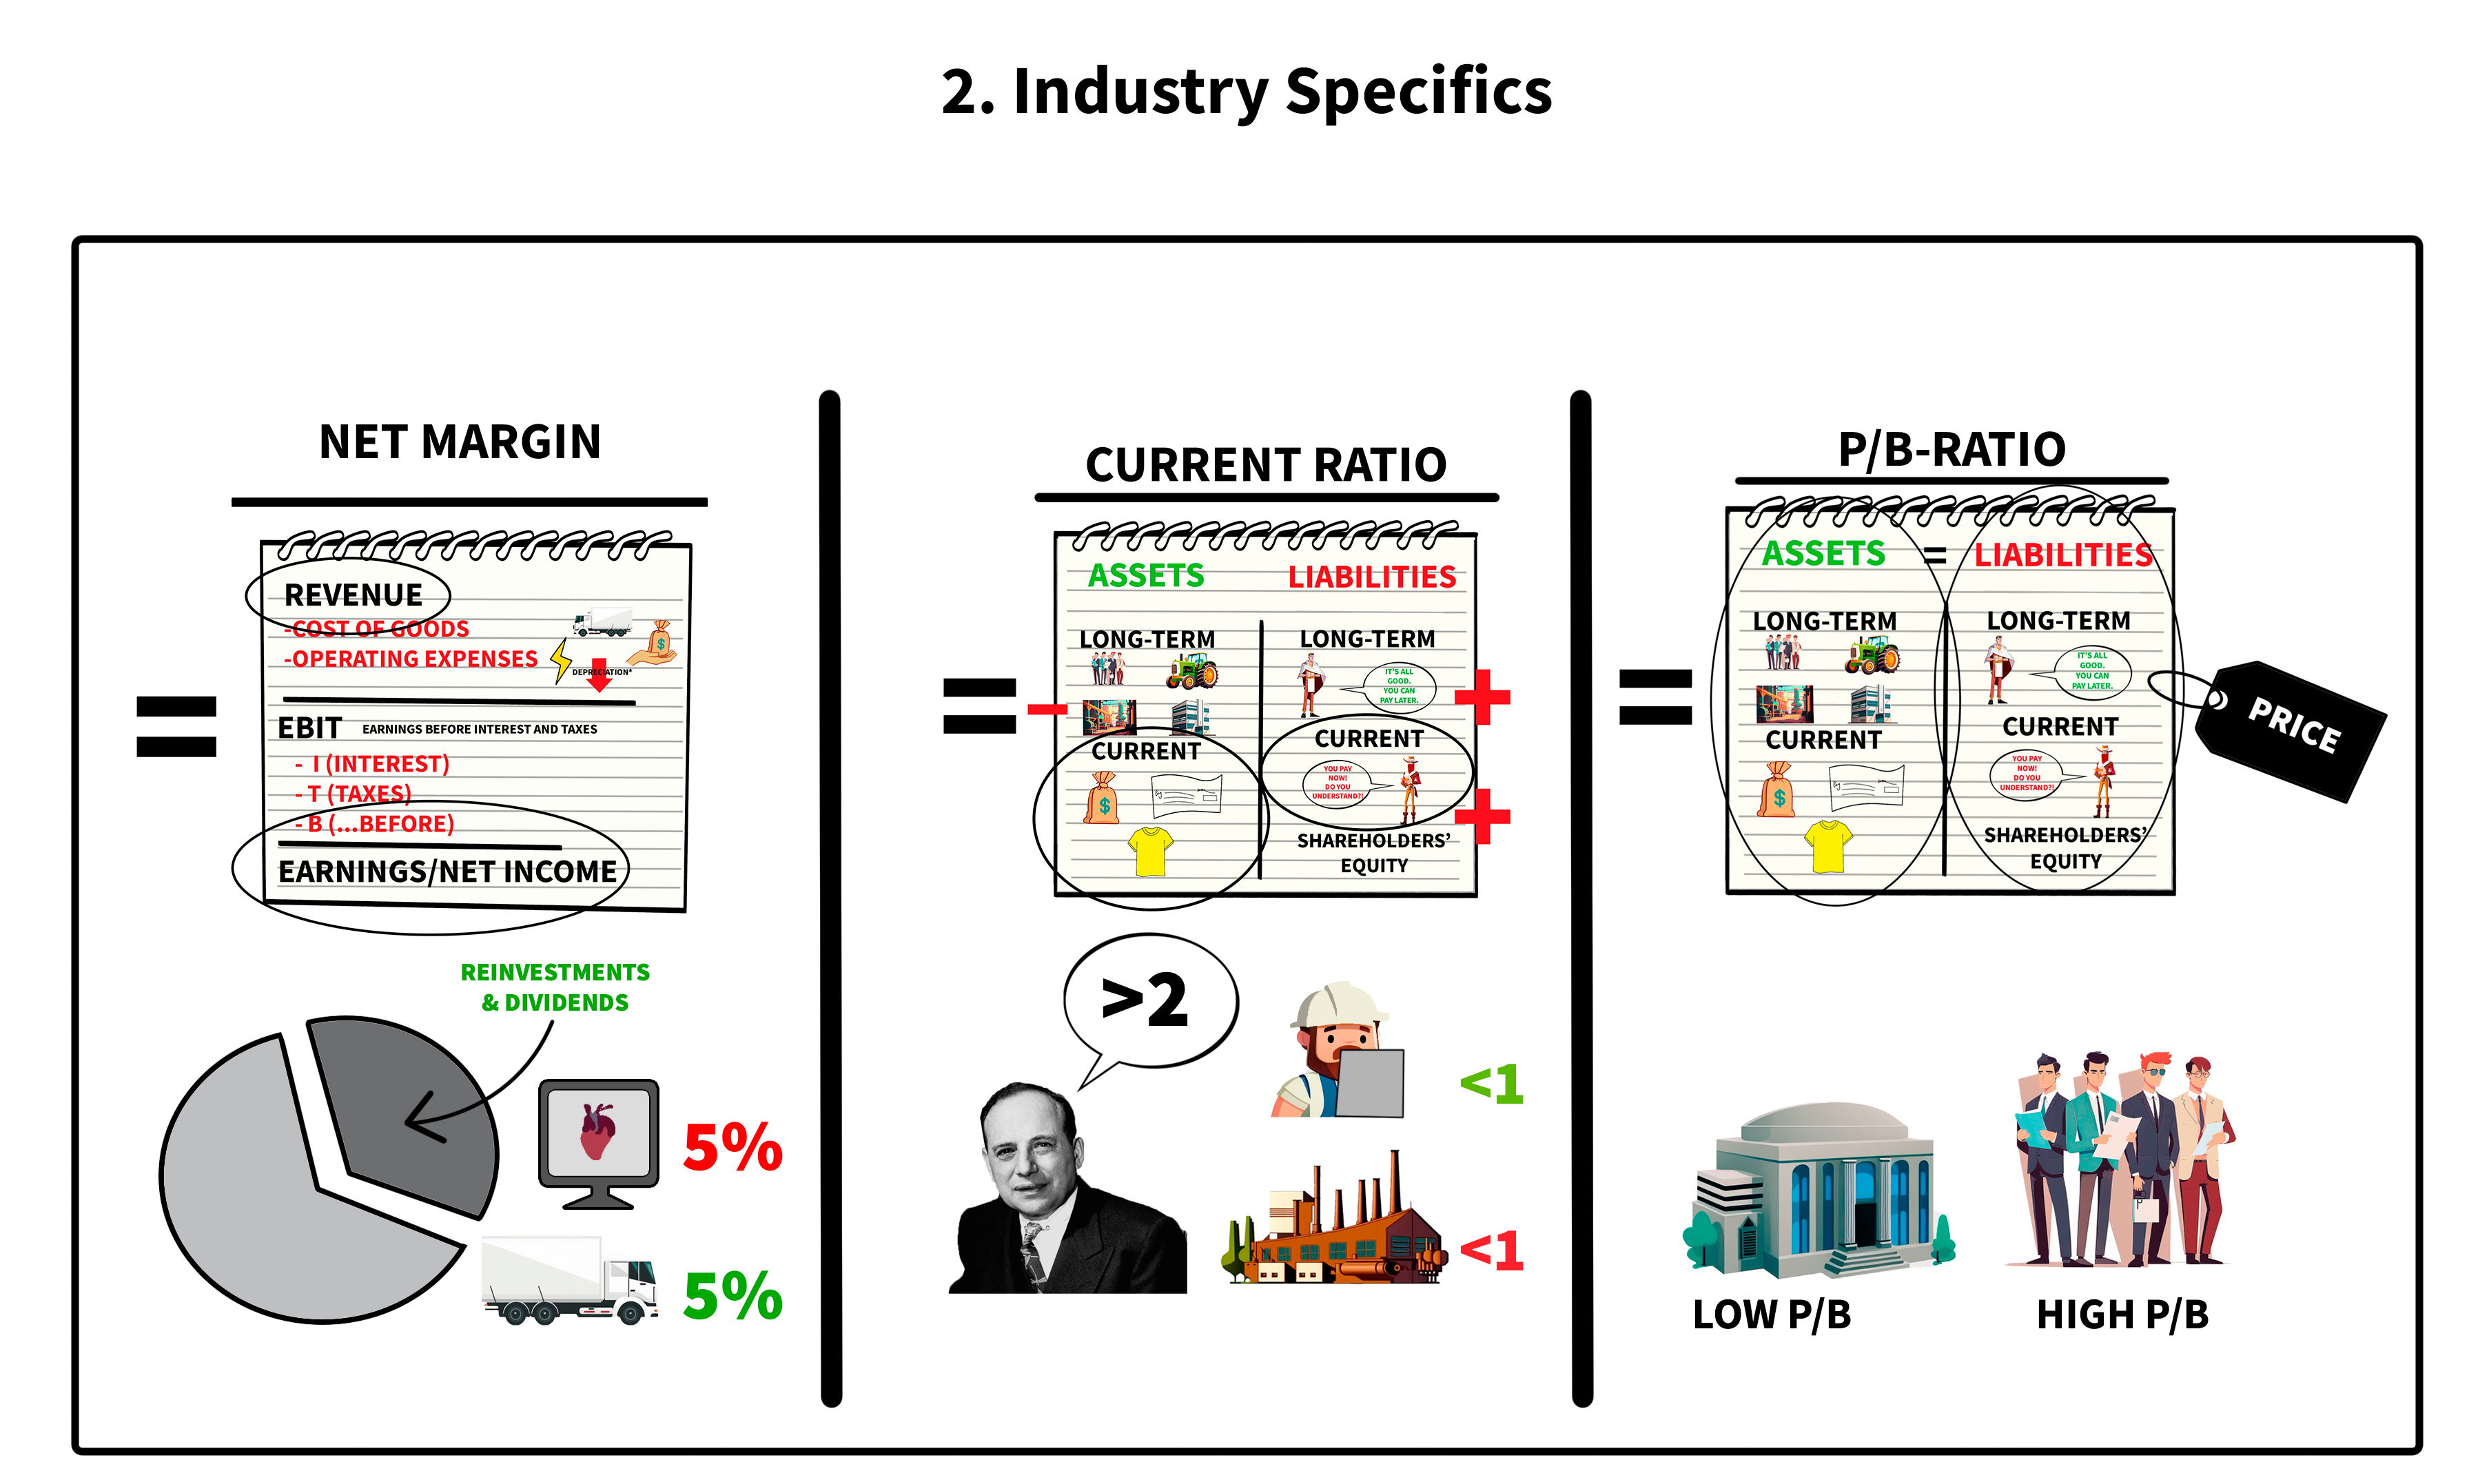
The net margin is highly dependent on the specific industry of the stock. For instance: A 5% margin would be considered terrible for a health technology firm, while it might be a great result for a distribution service firm.
What is the Current Ratio
This indicates whether the company will be able to meet its short-term obligations. If the number is less than one, the company will be forced to sell long-term assets, borrow more money, or seek additional capital from investors.
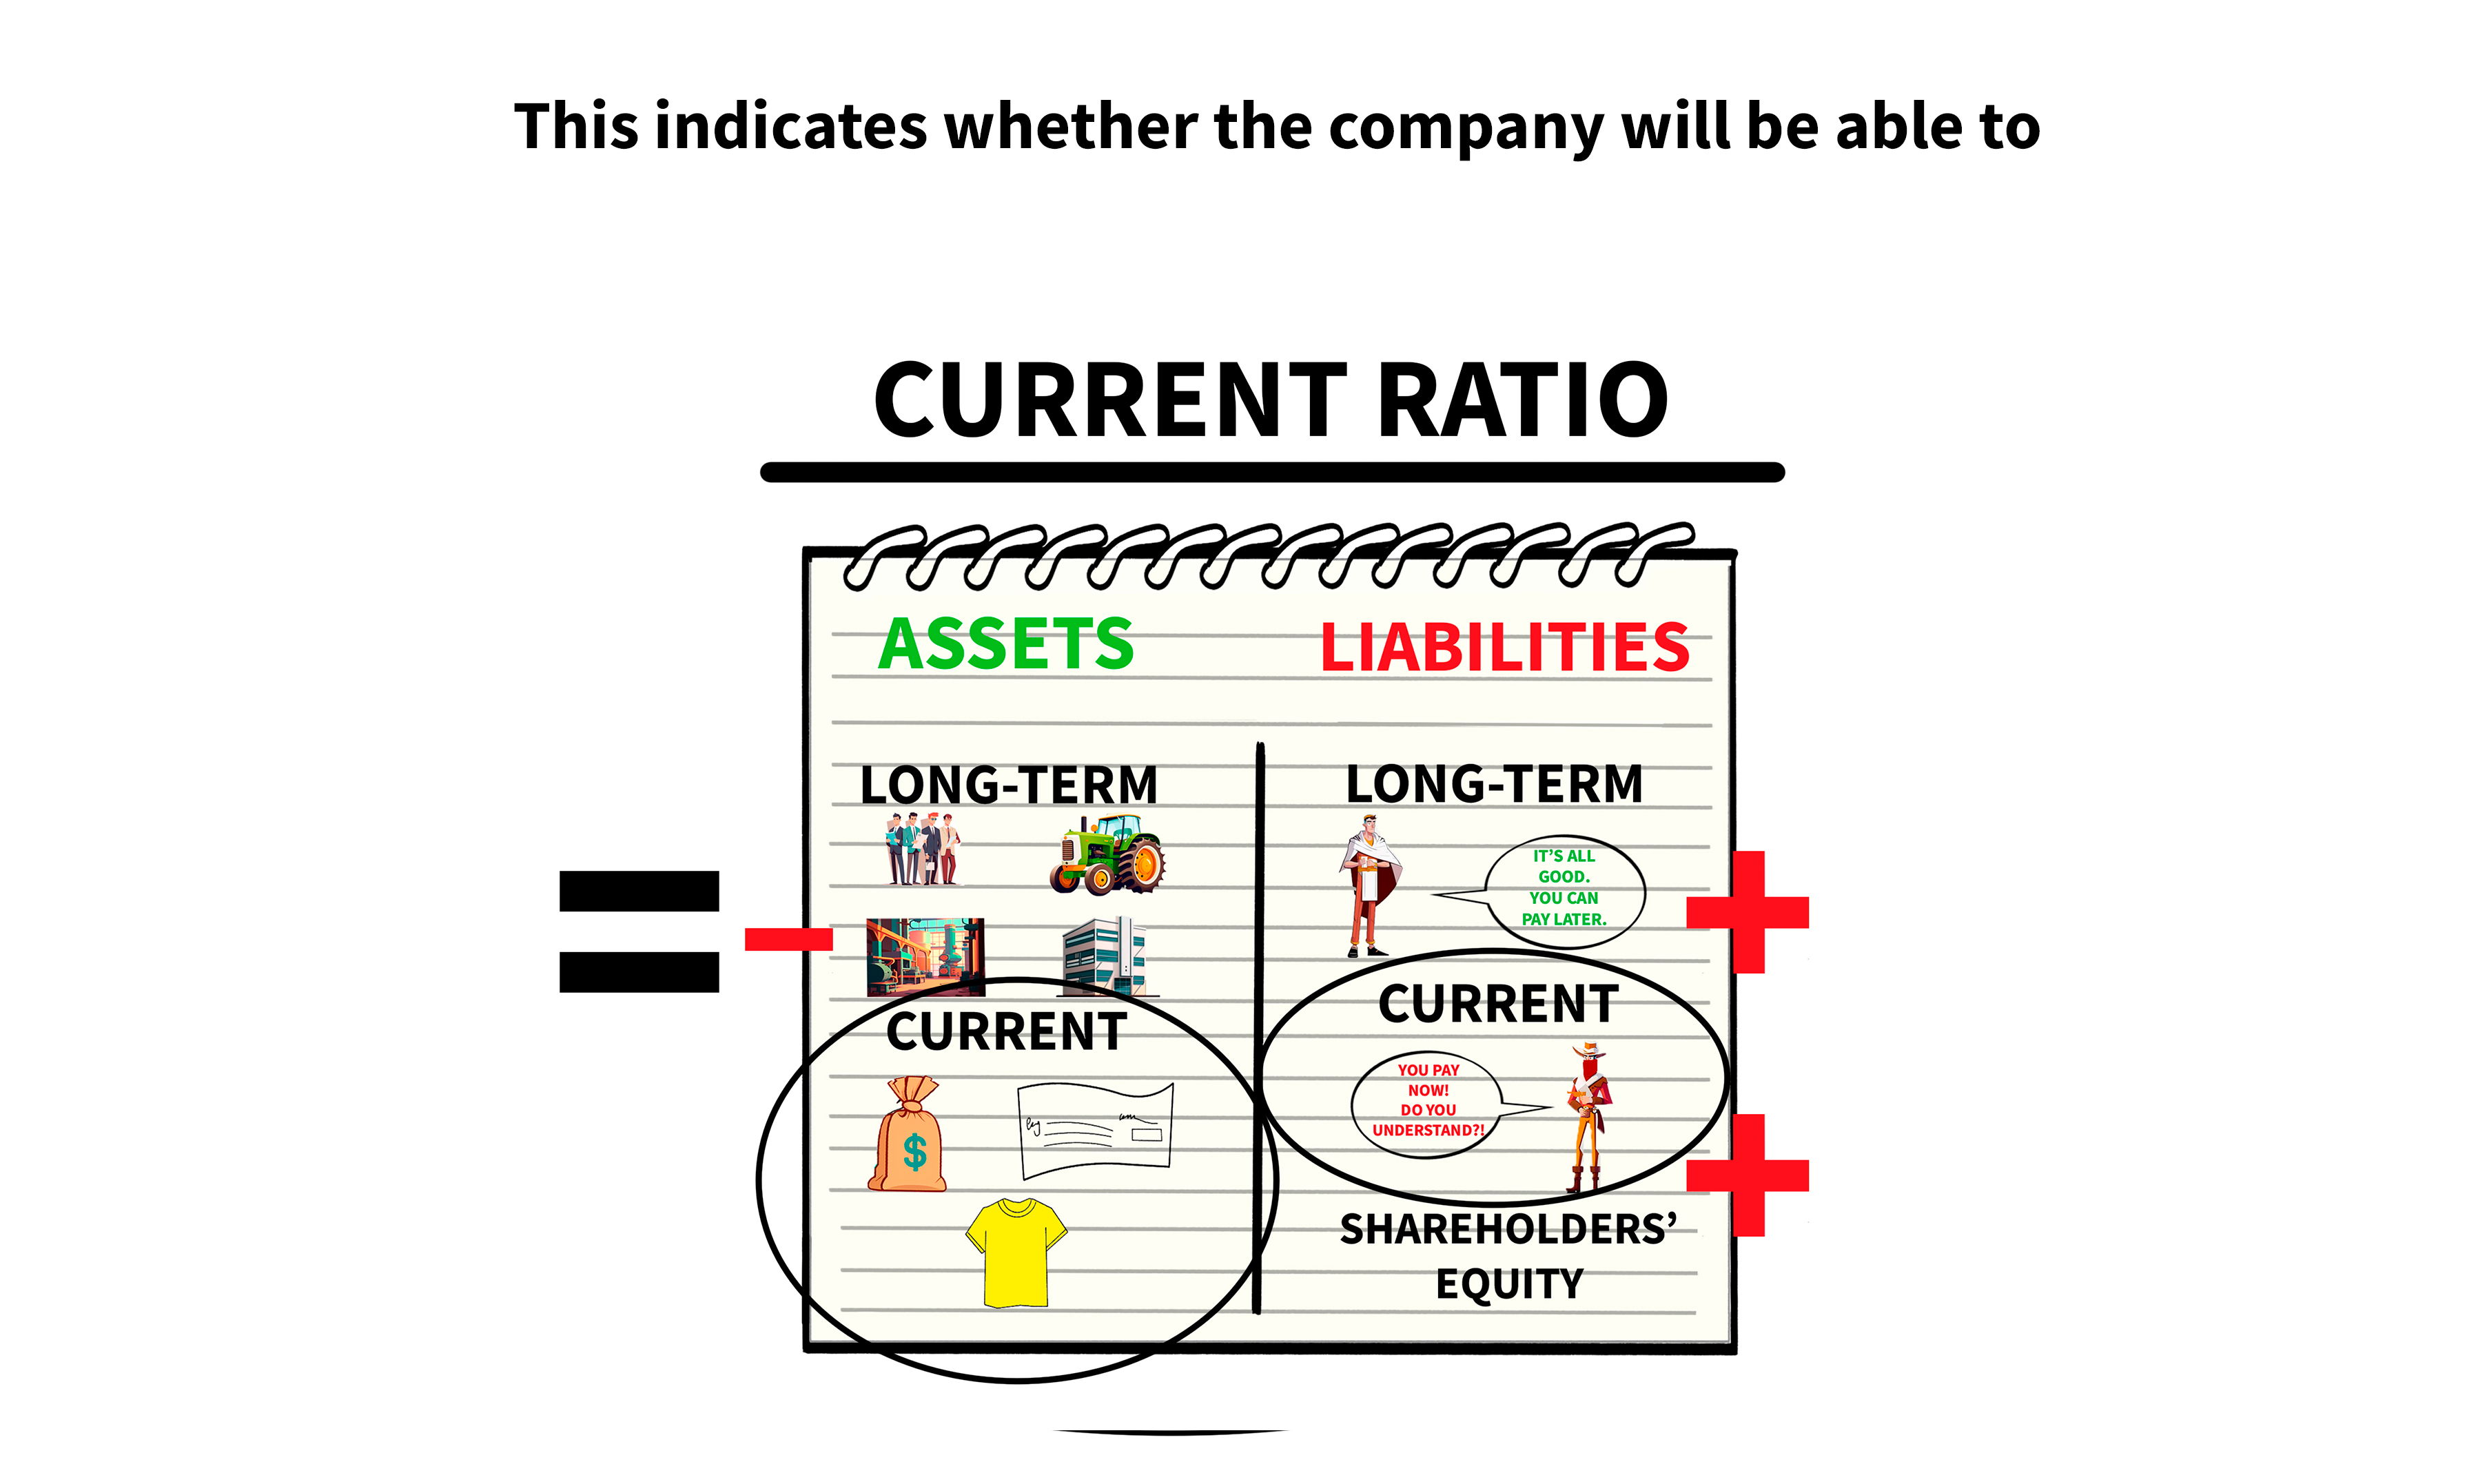
The ratio should be higher than two. However, this depends on the industry. For example, a construction company might be fine with a number slightly below one, if they have reoccurring profits and a small inventory. On the other hand, a manufacturing company at a number below one could be in a bad position. Particularly, if its inventory isn't liquid.
P/B ratio The P/B, or the Price-To-Book Ratio
It can be calculated by dividing the company's market cap by the total value of its balance sheet, which is equal to the sum of either the left or right side Once again, this is HIGHLY dependent on the industry. A money bank may have a large balance sheet and thus a low P/B ratio, whereas a consulting firm is inverse.
Takeaway number 3: Watered Stocks
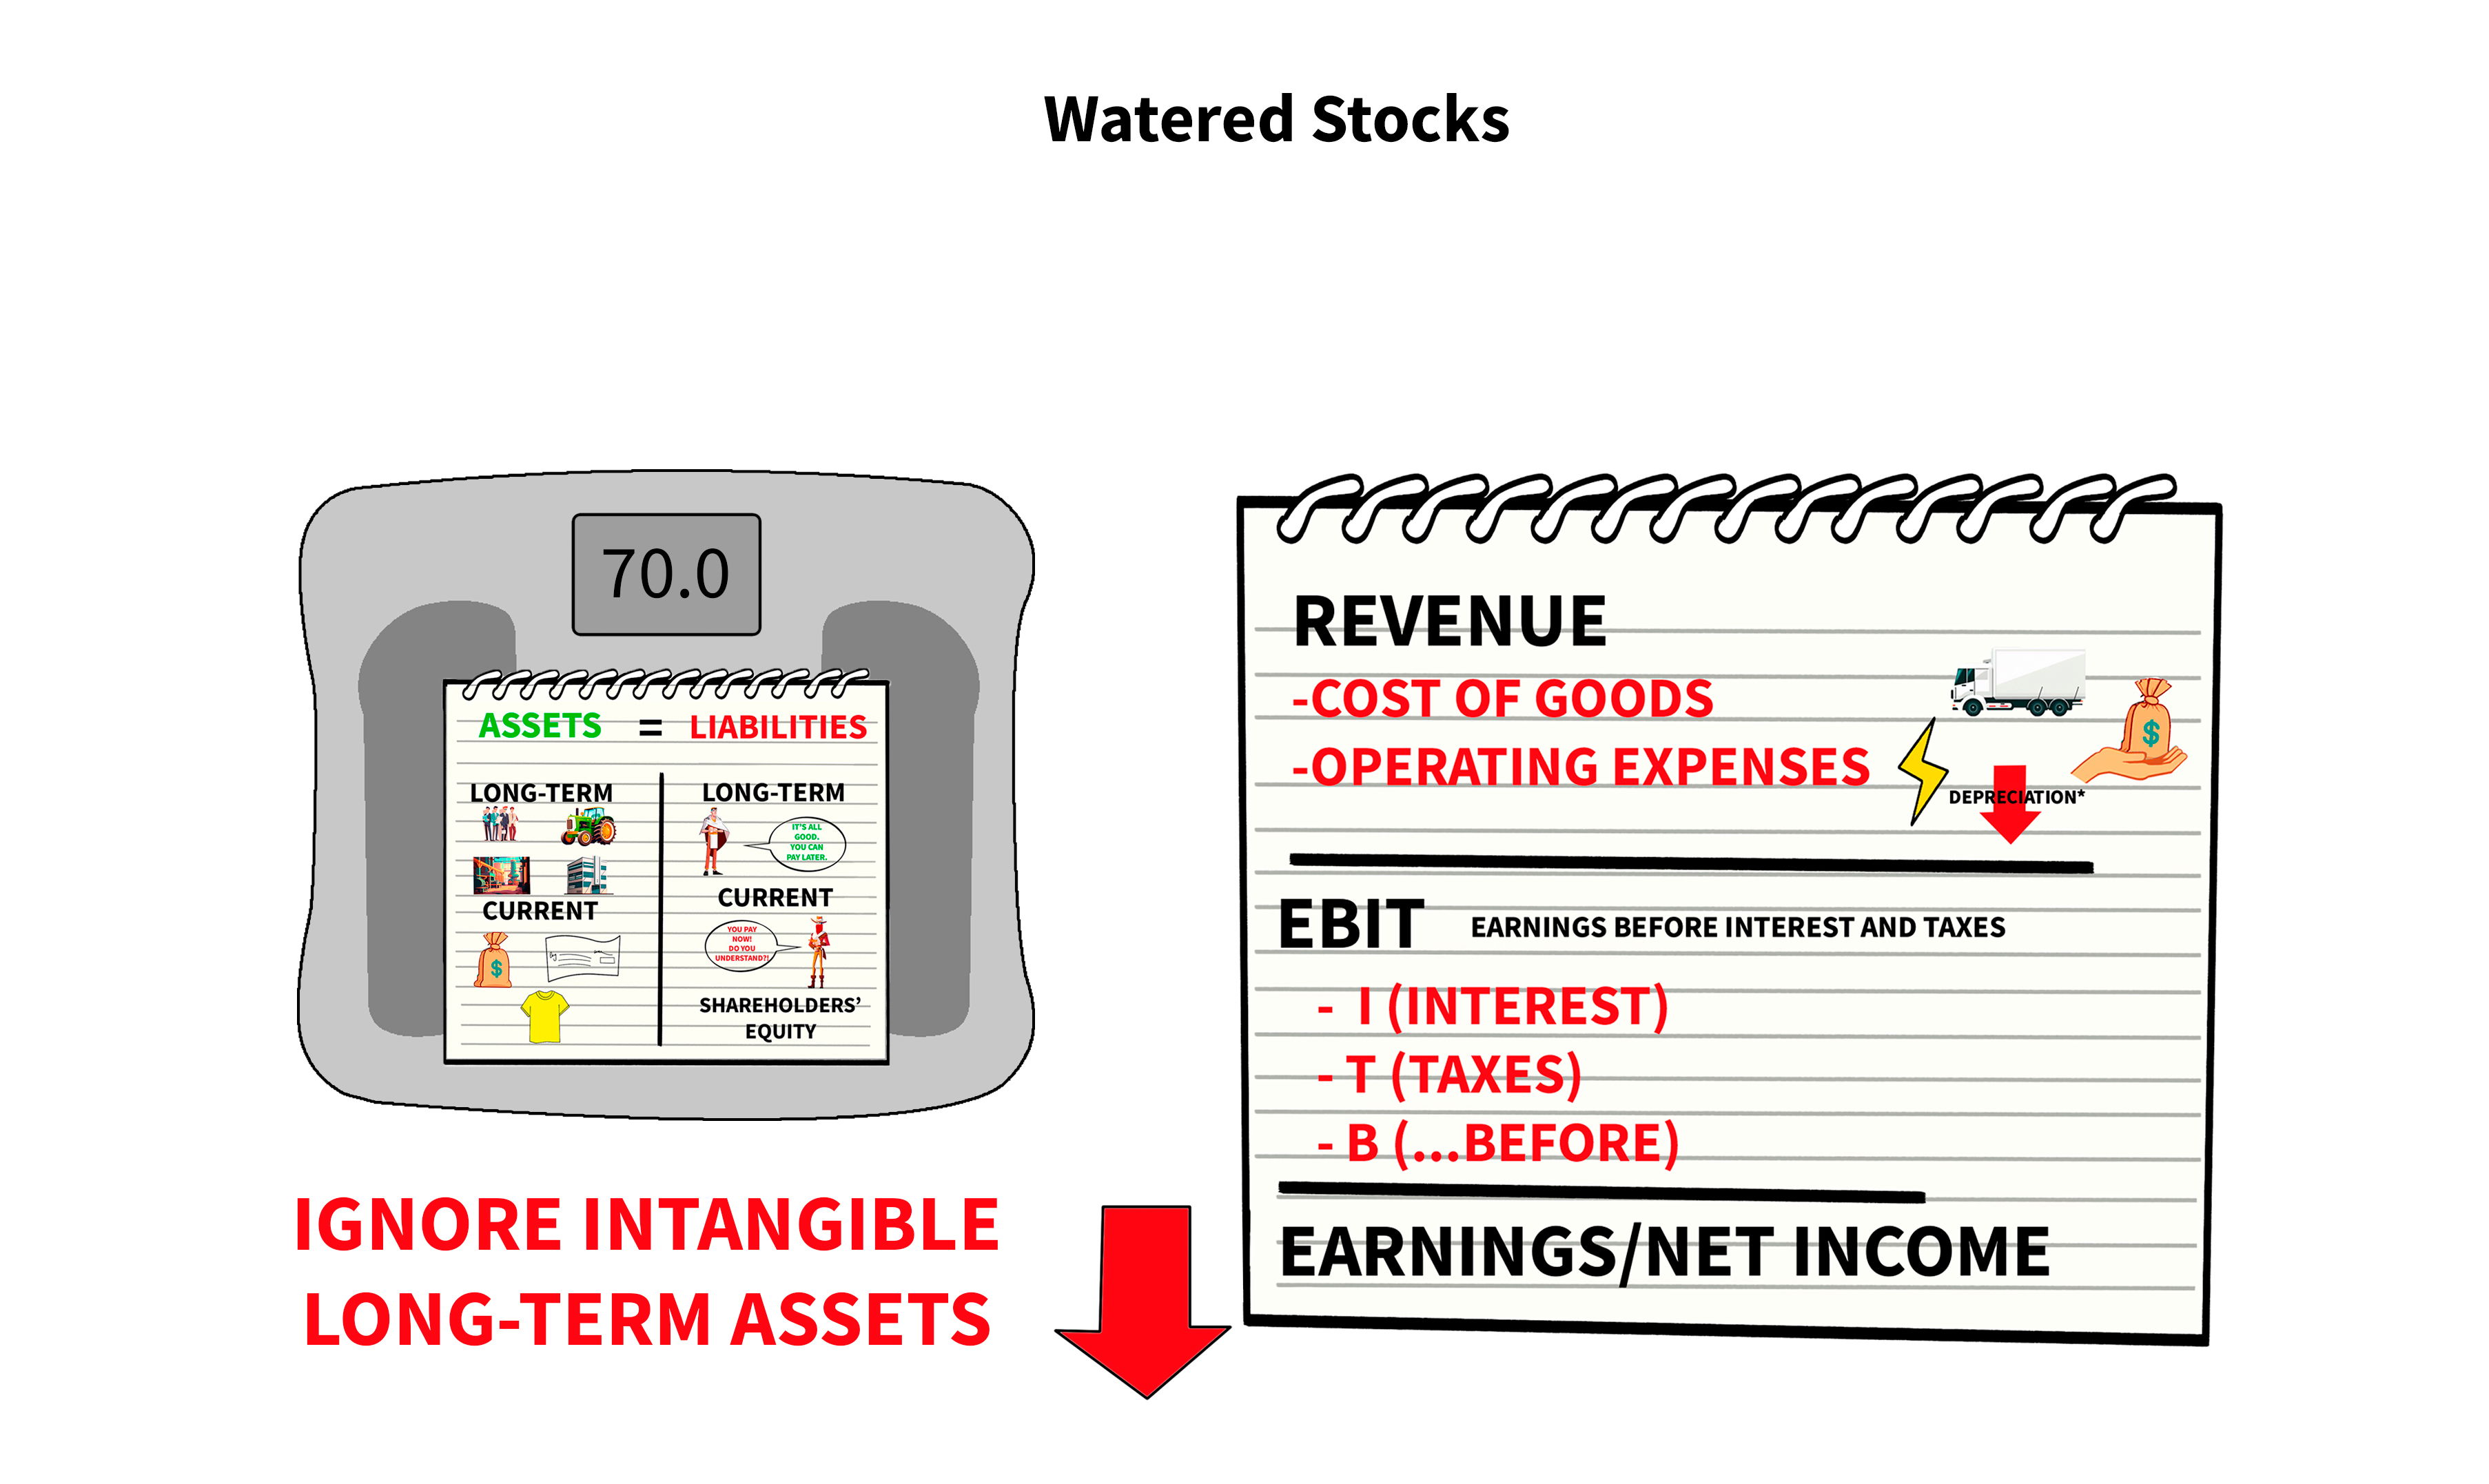
Stock watering originally was a method to increase the weight of livestock before a sale. The cattle were tricked into bloating themselves with water before being weighed during the transaction. This is so common for stocks traded in these security markets. Little to no importance at all should be given to the part of assets on the balance sheet that is referred to as intangibles. It's the income statement that reveals the real value of assets, not their arbitrary figures in the balance sheet.
Inflated balance-sheet numbers may cause problems for investors in the future, as the company may be forced to write down the value of these inflated assets. This leads to higher depreciation, which reduces the company's net income. If a company's total assets are worth more than its revenues, this should be taken into account, because the greater the assets, the greater the potential negative impact on earnings.
Takeaway number 4: The liquidation value of a firm
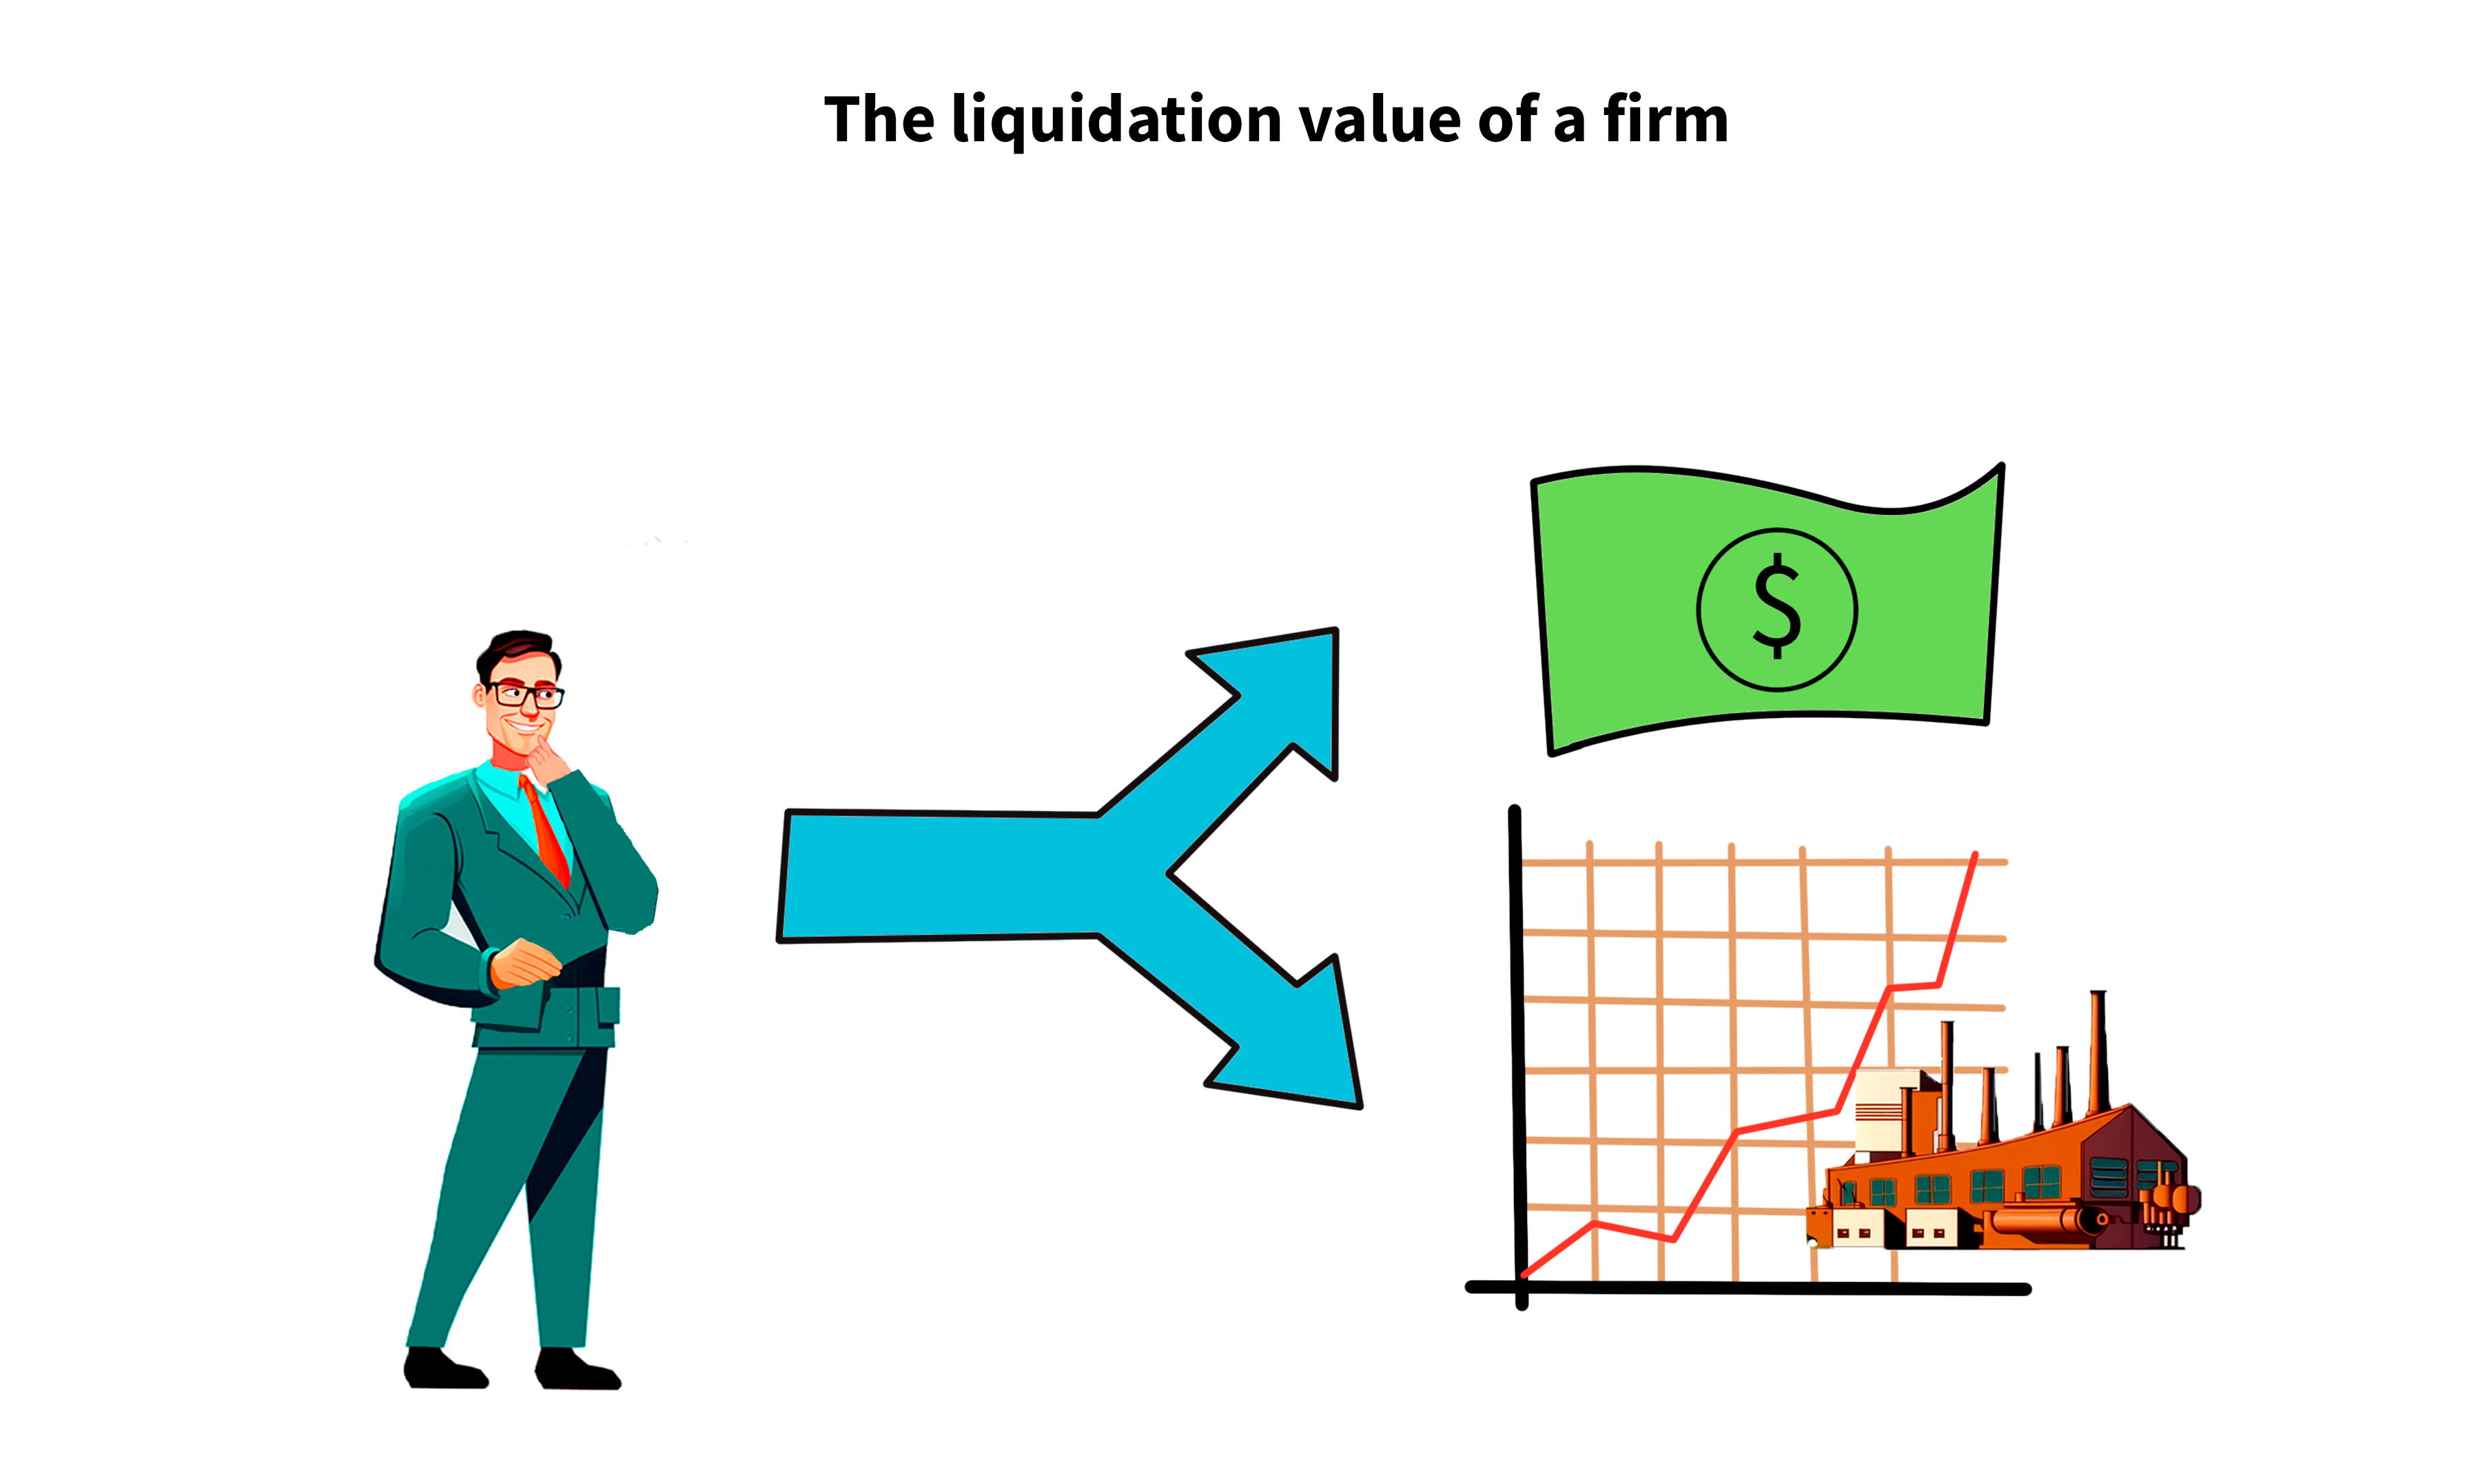
The goal of value investing is to find stocks that are priced lower than their intrinsic value. The intrinsic value is calculated by using fundamental analysis, and one method is the book value approach. If a firm was to sell off all its assets today and use that to repay liabilities, the remaining cash is referred to as book value. Although it's quite uncommon to see in today's market, a stock with a book value that exceeds its current market cap is an exciting opportunity.
In such a situation, shareholders are left with options. The downside of investing in the stock is limited, as the shareholders can decide to liquidate the entire business. At the same time, there's still a huge potential upside if the company manages to improve its business. A word of caution is required though. As mentioned in the previous takeaway, the assets of a company can be watered.
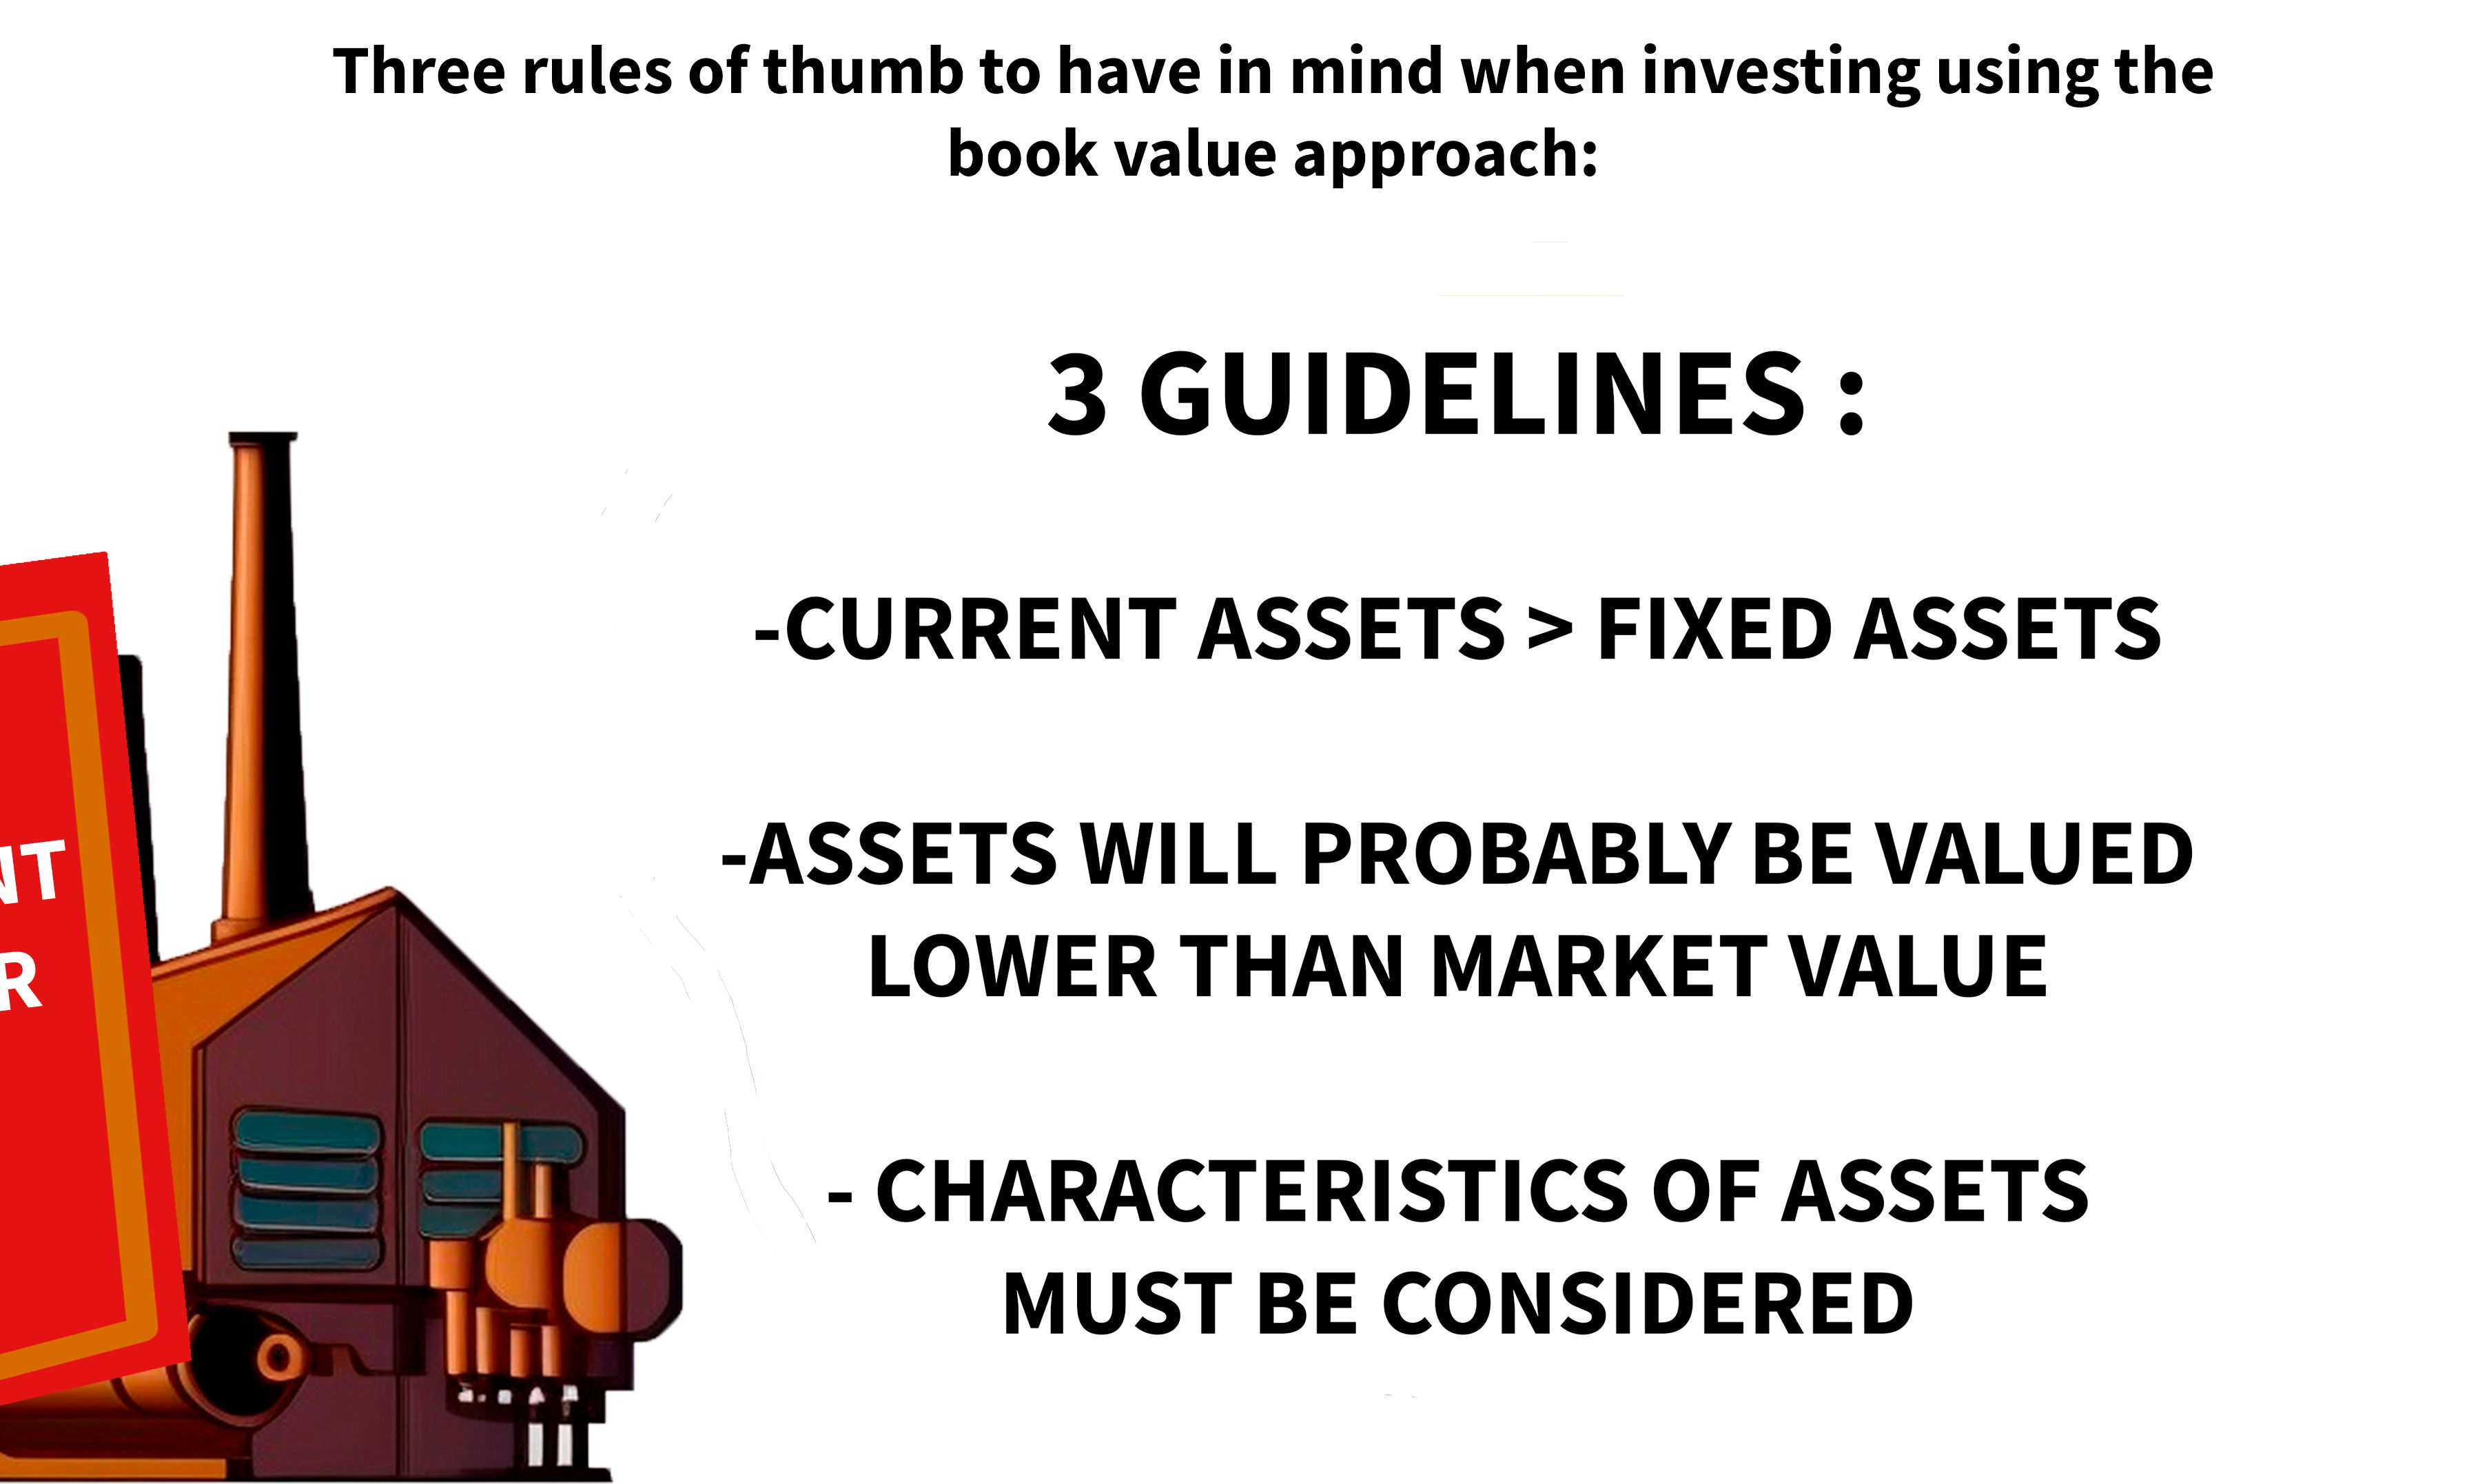
Here are three rules of thumb to have in mind when investing using the book value approach:
1. Current assets are typically valued at fairer prices than fixed ones.
2. The company is in a bad bargaining position in the event of a liquidation, so assets should probably be valued lower than market value.
3. The characteristics of the assets must also be considered.
A specialized manufacturing company will probably have a harder time selling off its manufacturing plants than a bank or an insurance company will have to sell off its financial assets.
Takeaway number 5: Expected returns of the quantitative investor
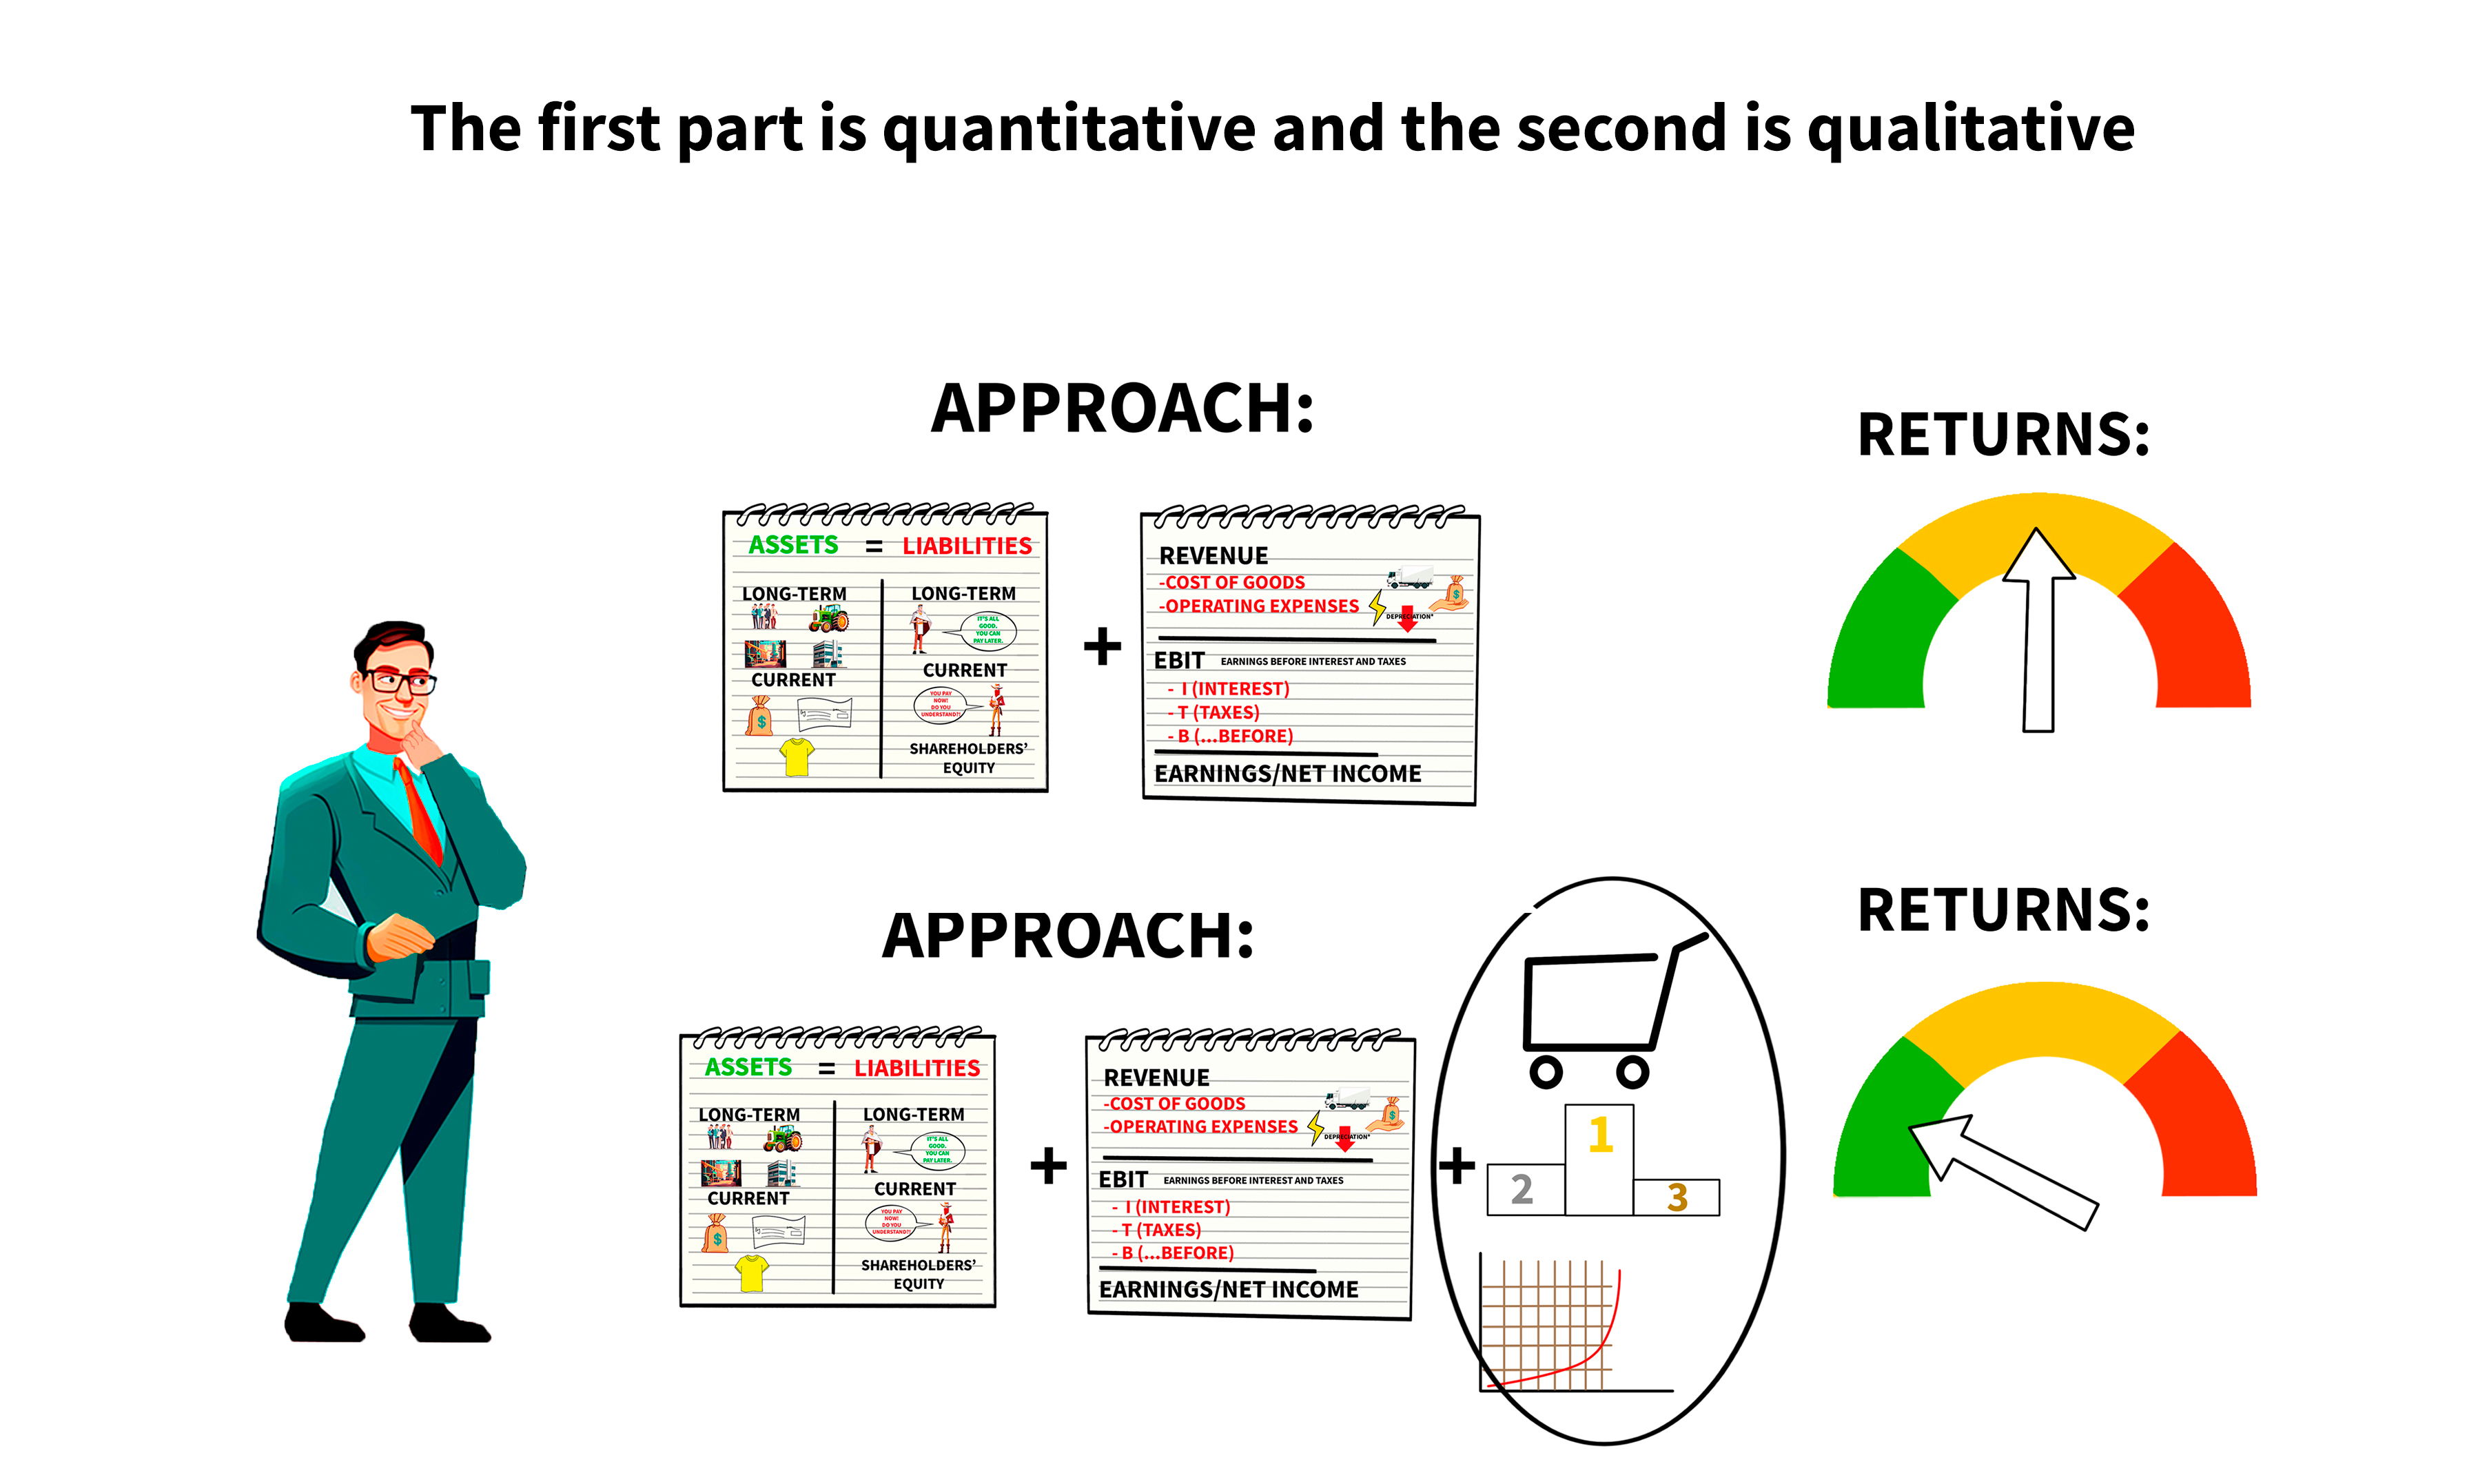
An investor that buys stocks when companies look cheap according to their financial statements and sell when they look expensive according to the same statements, will probably not make any spectacular profits. On the other hand, the investor will probably avoid big losses. Let’s try to filter out companies that look healthy based on financial statements and ratios, and secondly, filter them out based on market trends, competition, scalability, and so on.
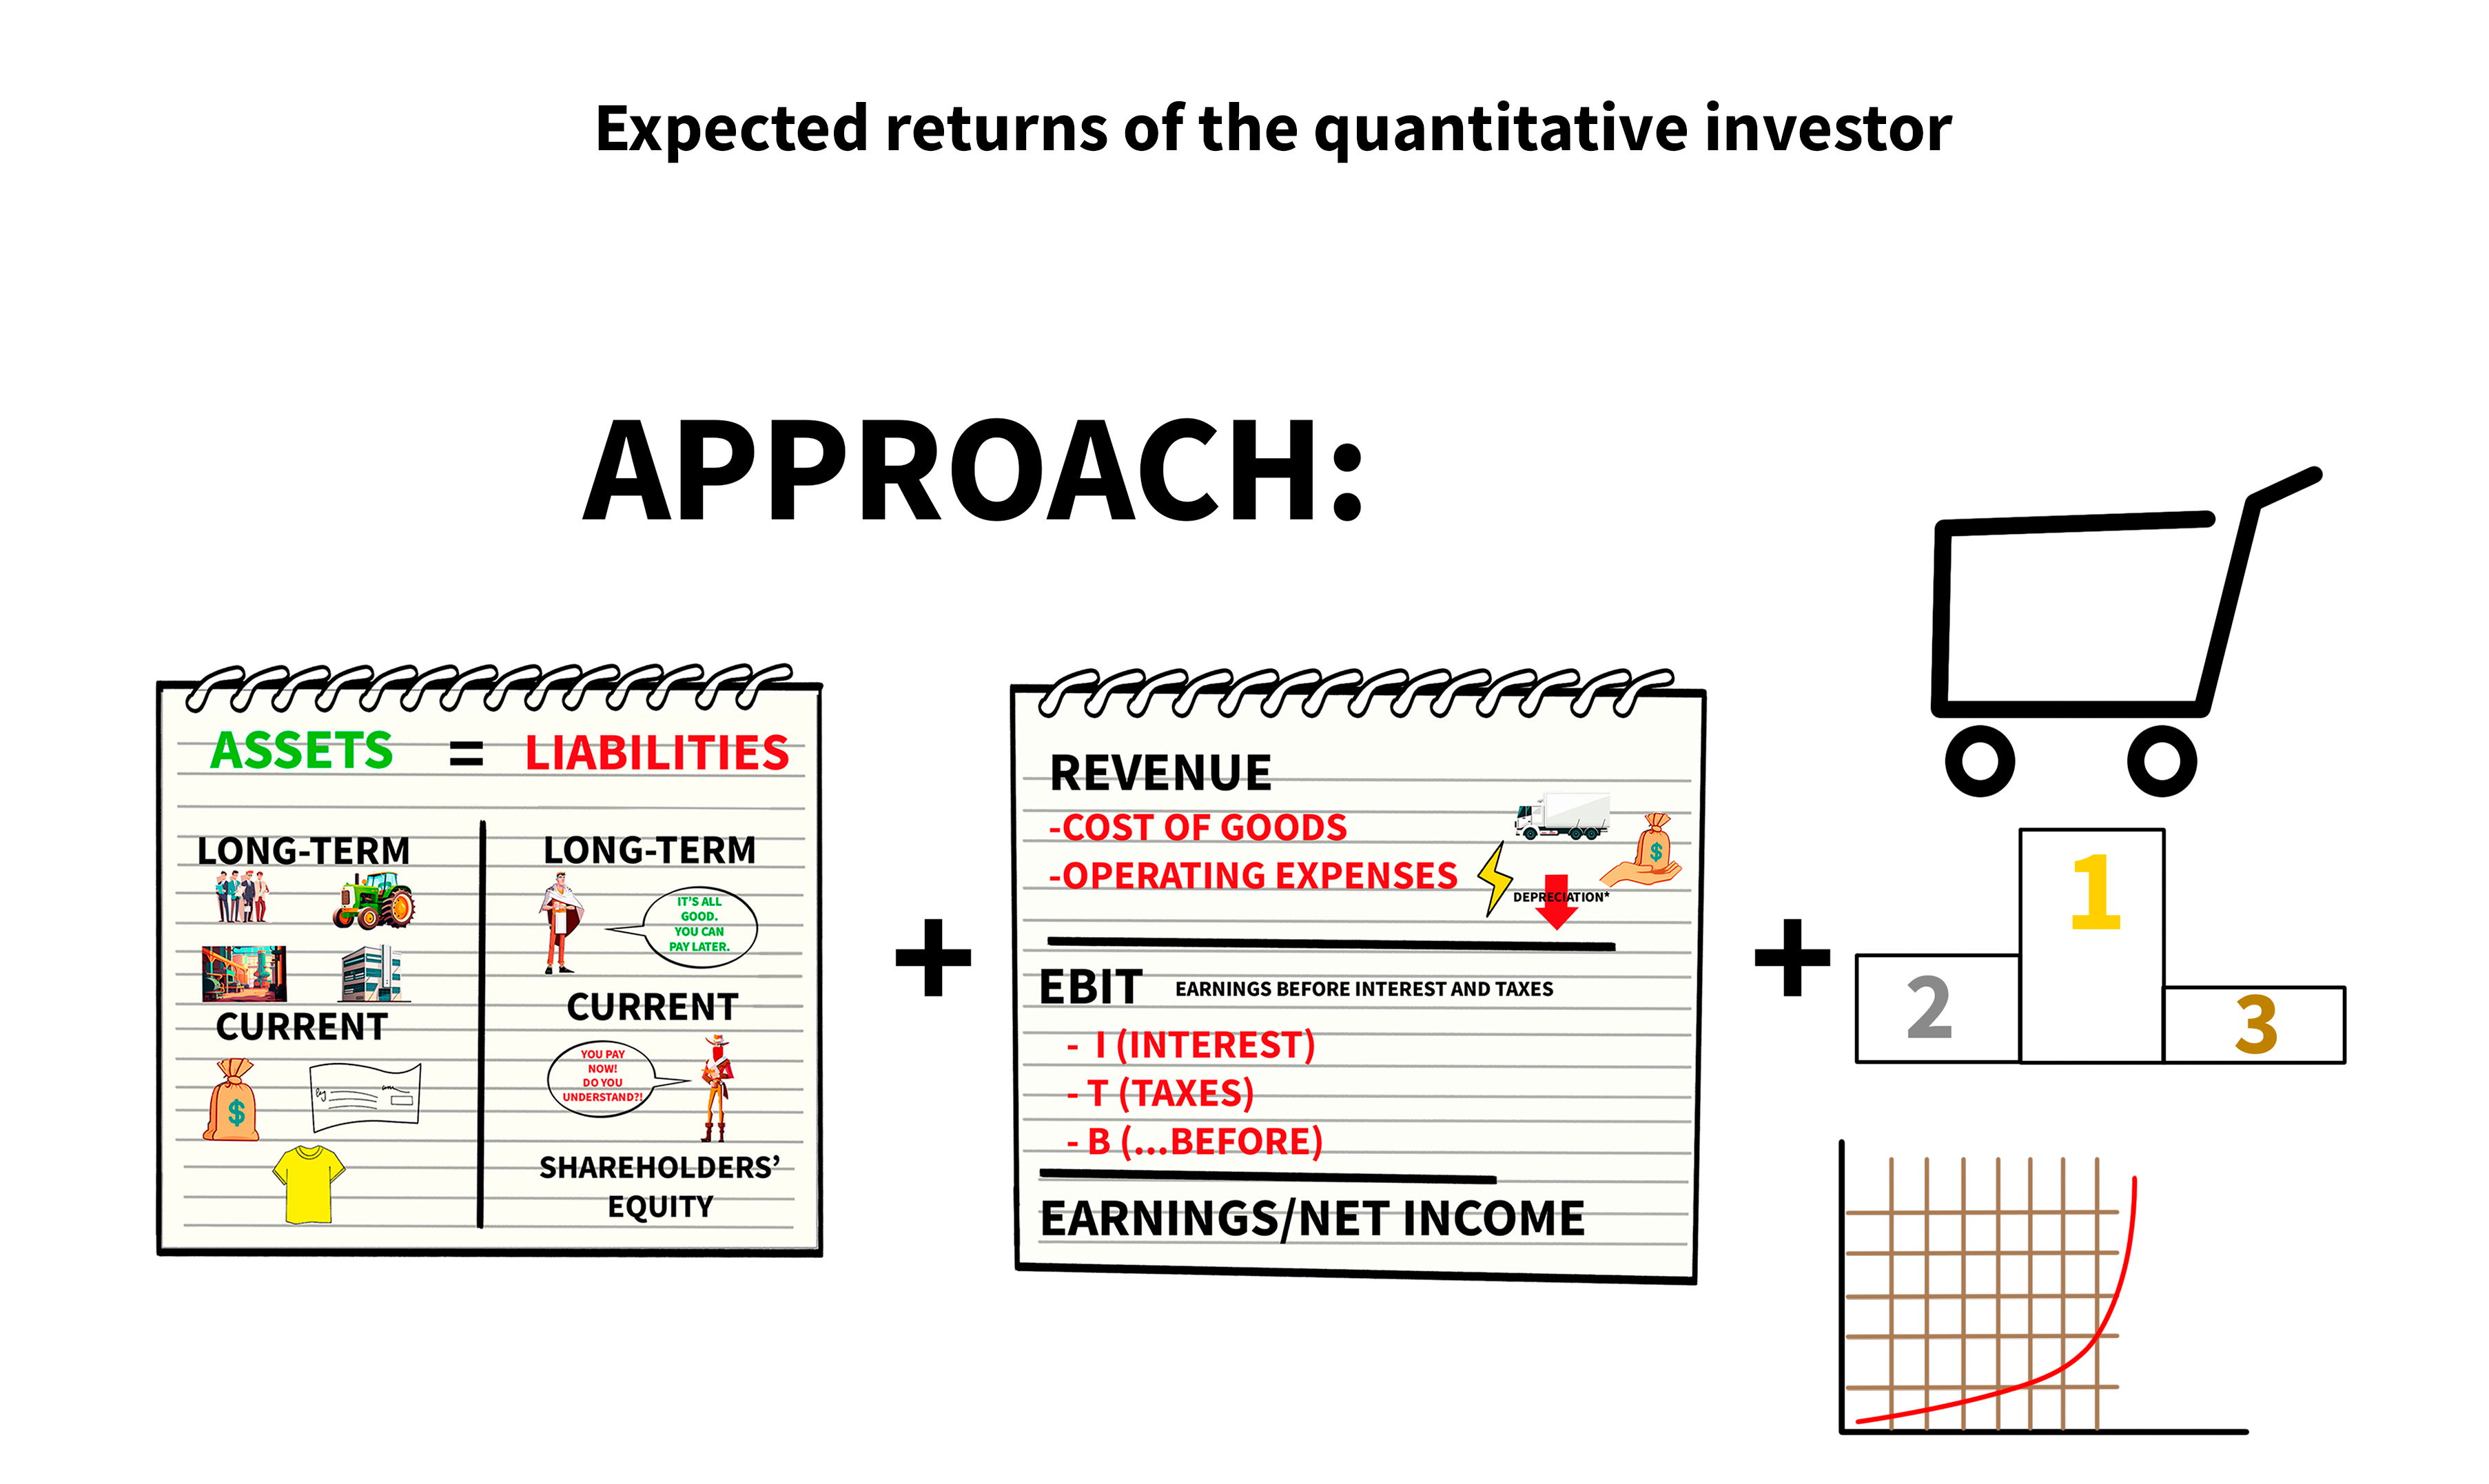
The first part is quantitative and the second is qualitative. The second part is way more time-consuming, but this is also the one that can turn an average stock market return into a spectacular one.
Know thy income statements and balance sheet Ratios are useful when considering the fundamentals of a company, however, be mindful if the numbers are healthy or not depends on the industry. It's quite common that stocks are "watered" to look like they perform better than they actually do.
If a stock is priced lower than its current book value, the intelligent investor should take a closer look. This could be a great value investing opportunity. To achieve maximum portfolio returns, the value investor should do both a quantitative and qualitative analysis of his stock market investments.


